
IELTS writing task 1: Could you please check my essay?
The charts below show the results of a survey conducted by a university
library to find out the opinions of full-time and part-time students about its services.
Essay
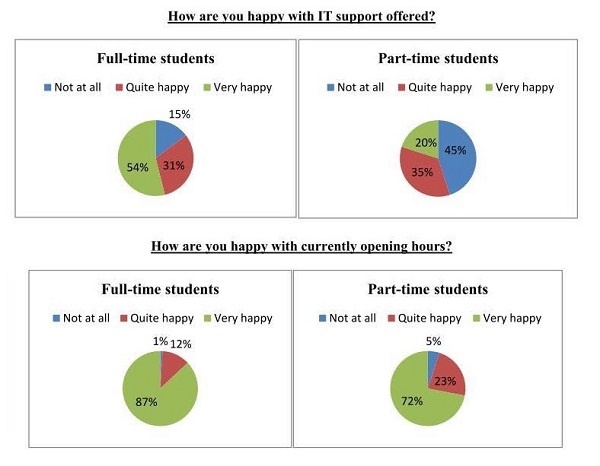
The pie charts illustrate the results of a survey carried out by a university library to find out the opinions of full-time and part-time students, about its IT support and opening hours.
Overall, it is showed that full-time students are more satisfied with IT support than part-time students, whilst part-time students are happier with the opening hours.
As for IT support, the number of full-time students who are very satisfied is more than triple to that of part-time students, at 55% and 20% respectively. Students in both sides share almost the same proportion in being quite happy, with 32% for full-time students and 35% for part-time students. Also, the number of part-time students who are the least satisfied are over three fold larger than the other, showed by the relative figures 45% and 13%.
In terms of opening hours, nearly three-quarters of full-time students said they were very happy, at around 67%, whilst the figure even grows larger to 72% for part-time students. The proportions of students who are the least happy in both sides are significant small, at 1% and 5% respectively. Moreover, there is an inconsiderable difference in percentages between full-time students and part-time students saying they were quite happy, about 9% in favour of part-time students.
Top answer
The four pie charts illustrate (present / show / give ) the results of a survey carried out by a university library to find out the opinions of full-time and part-time students, (no comma) about its IT support and opening hours. Overall, it is showed that (unnecessary verbiage) full-time students are more satisfied with IT support than part-time students, whilst part-time students are happier with the opening hours . (Really?
- The four pie charts illustrate (present / show / give ) the results of a survey carried out by a university library to find out the opinions of full-time and part-time students, (no comma) about its IT support and opening hours.
- Overall, it is showed that (unnecessary verbiage) full-time students are more satisfied with IT support than part-time students, whilst part-time students are happier with the opening hours .
- (Really?
- ) As for IT support, the number (wrong word) of full-time students who are very satisfied is more than triple (Incorrect.
- Triple 20% is 60% and 60% is less than, not more, than 54%) to that of part-time students, at 55% and 20% respectively.
Get the Weekly English Kit 📬
New words, one handy idiom, and a 2-minute quiz — delivered to your inbox to keep your streak alive.
The four pie charts illustrate (present / show / give ) the results of a survey carried out by a university library to find out the opinions of full-time and part-time students, (no comma) about its IT support and opening hours.
Overall, it is showed that (unnecessary ver
 Related Questions