
Ielts writing task 1 correction
Hello everyone , here is my essay for the topic . Could you guys please help me to correct it ? Thanks
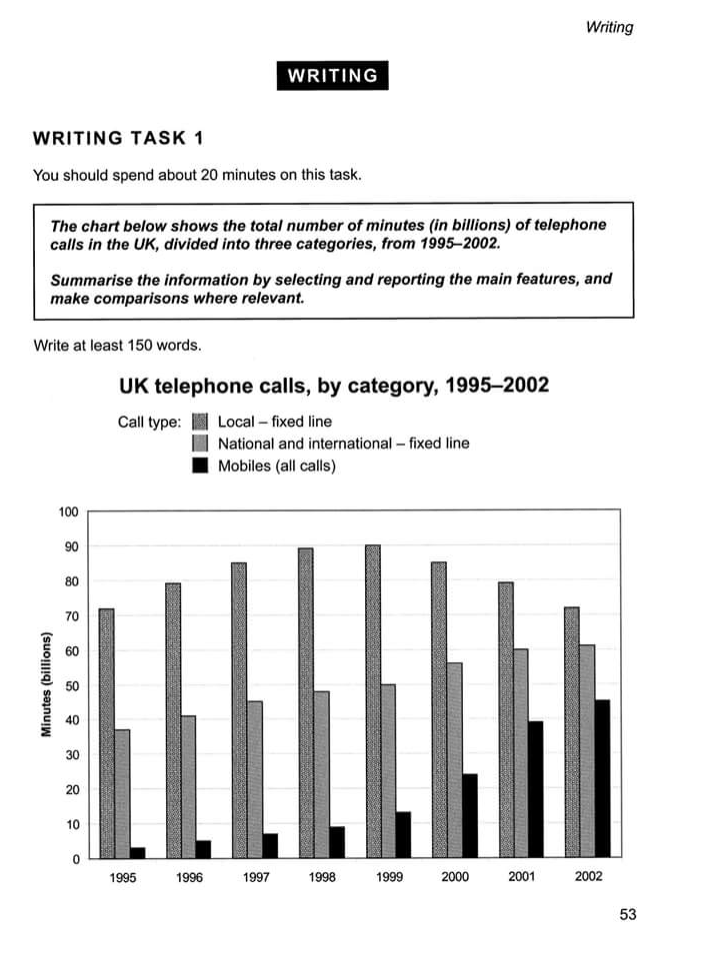
The graph illutrates the quantity of minutes duration among different types of telephone calls in Uk , between 1995 and 2002.
It is clear that the local line category was mostly used , while the minutes spent on mobile call was lowest . Additionally , the mobile line and national and international line category experienced the upward trend during the research period.
In 1995, the local line category was highest , at more than 70 billion minutes , while the figure for national and international line was lower , at 38 billion minutes.About 2 billion minutes were made from mobiles line . From 1995 to 1999 , there were dramatic increase to 90 billion minutes , 50 billion minutes and 12 billion minutes in the number of local call, national & international call and mobile phone call.
In 2002 , there was a slight drop to 72 billion minutes in using local call . By constrast , the number of minutes (in billion) of national & international call and mobile phone call rose to 60 billion minutes and 45 billion minutes respectively.
WRITE DESCRIPTION HERE
Top answer
You make a lot of spacing errors. Put a space after a punctuation mark. Do not put a space before a punctuation mark.
- You make a lot of spacing errors.
- Put a space after a punctuation mark.
- Do not put a space before a punctuation mark.
- Also, you make a lot of mistake in singular versus plural nouns.
- The graph (wrong word.
Get the Weekly English Kit 📬
New words, one handy idiom, and a 2-minute quiz — delivered to your inbox to keep your streak alive.
You make a lot of spacing errors. Put a space after a punctuation mark. Do not put a space before a punctuation mark. Also, you make a lot of mistake in singular versus plural nouns.
The graph (wrong word. This is not a line graph, although you could derive a graph from it.)
 Related Questions