
IELTS Writing Task 1 Column Graph
The graph below show current rates of secondary and higher education among people in various parts of the world.
Summaries the information by selecting and reporting the main features, and make comparisons where relevant.
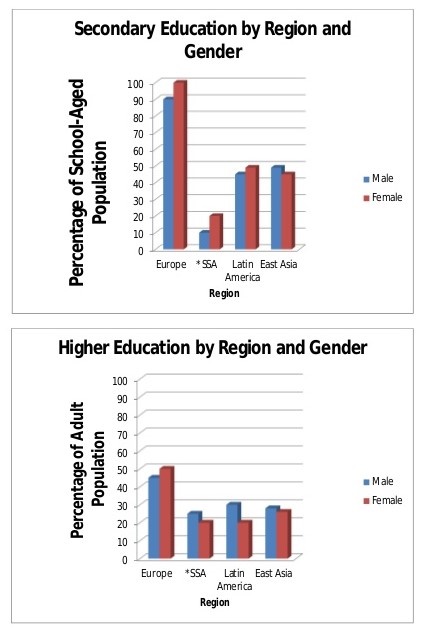
The two bar charts compare the percentage of males and females in secondary and post secondary level of four different parts of the world, namely Europe, Sub-Sahara Africa, Latin America and East Asia.
Generally, European students are likely to pursuit and continue their education path rather than in other regions. And the people in Sub-Sahara being the most less-educated in both secondary and higher education. Aside from that, there is a difference in the number of males and females attending to secondary school with more female participating in than their male counterparts. However, the situation in East Asia seems to be reversed with males received proper education being higher than females. And the Latin American education rate is exactly the same that of East Asian rate with the exchanging of male and female population.
In higher education level, men are likely to be involved in rather than women except in Europe. Nearly fifty percent of European woman population continue their education road comparing to fifty-five percent of European men in education field. However, the number of woman attending to higher education in East Asia is only half the amount in Europe. For other regions, the rates of women received higher education level are all below twenty percent.
It is worthy to note that when almost all of the European attending to secondary school, only half of them continues their study into higher education.
Get the Weekly English Kit 📬
New words, one handy idiom, and a 2-minute quiz — delivered to your inbox to keep your streak alive.
 Related Questions