
Ielts Writing Task 1 - Bar Graph - Fast Food Consumption?
This is my essay for IELTS Writing Task 1. I would be grateful if someone here could provide some comments.
Ielts Writing Task 1 - Bar Graph - Fast Food Consumption
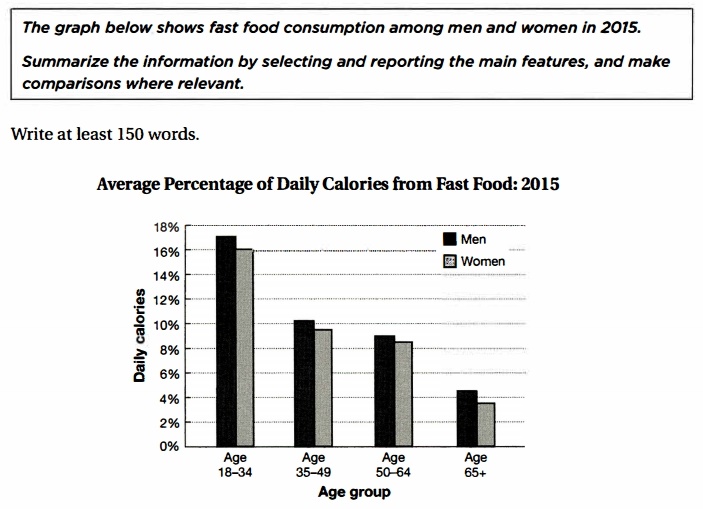
The bar graph shows the percentage of fast food calories on average consumed by people at different age and gender in 2015. For each group of age, males ate up more fast food than females did.
The men’s consumption of fast food decreased as they got older. Males who were from 18 to 34 years old ingested the most calorie, with an average of about 17% a day. This number dropped dramatically to just a little over 10% as the age was between 35 and 49 – nearly two-thirds of that of males in their 18s to 34s. From 50 to 64 years old, the daily calories consumption of men was approximately equal to that of the previous age group. Another significantly fall was shown on the graph, from around 9% to almost 5% when they reached the age of 65 and above.
Females’ average percentage of daily calories from fast food, on the other hand, had the same trend. Women in their 65s and older, consumed the least fast food calories – no more than 4% per day. However, this number was higher when they were younger. The percentage was a little more than 8% and nearly 10% for those who were from 50 to 64 and from 35 to 49 years old, respectively. The highest consumption was 16% for the group of age between 18 and 34, just like men.
(230 words)
Top answer
The bar graph shows the percentage of fast food calories on average consumed by people at different age and gender ("at different gender" is not good English) in 2015. For each group of age , (age group) males ate up more fast food than females did. The men’s consumption of fast food decreased as they got older.
- The bar graph shows the percentage of fast food calories on average consumed by people at different age and gender ("at different gender" is not good English) in 2015.
- For each group of age , (age group) males ate up more fast food than females did.
- The men’s consumption of fast food decreased as they got older.
- Males who were from 18 to 34 years old ingested the most calorie , (wrong form) with an average of about 17% a day.
- This number dropped dramatically to just a little over 10% as the age was (??
Get the Weekly English Kit 📬
New words, one handy idiom, and a 2-minute quiz — delivered to your inbox to keep your streak alive.
The bar graph shows the percentage of fast food calories on average consumed by people at different age and gender ("at different gender" is not good English) in 2015. For each group of age, (age group) males ate up more fast food than femal
The rendered bar graphs elucidate information about the percentage of male and femles in different age groups who ate calories in 2015
Overview what stand out from the graph that there were males more consumed calories from fast food ratherthan females in given period
 Related Questions