
[IELTS writing task 1 - BAR CHART] please review the essay for me
The following is my essay of IELTS writing task 1. Please take your time to review it for me.
Thanks in advance!
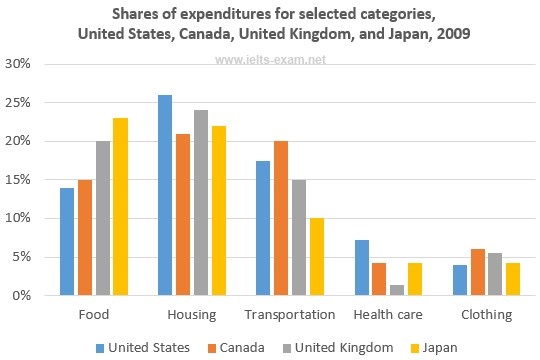
The bar graphs compares four different nations, namely the United States, Canada, the United Kingdom, and Japan, in terms of the percentages of expense for five categories including food, housing, transportation, health care and clothing in 2009.
Overall, the proportions of expenditures for housing, food and transportation outnumbered the other categories in these countries in this year.
As can be seen from the chart, the expense of housing in the United States accounted for the highest proportion with around 26%, followed by the United Kingdom, Japan and Canada with 24%, 22% and 21% respectively. Meanwhile, the figure for Japan on food was slightly higher than others countries, at 23%, compared with 20%, 15% and 14% of the United Kingdom, Canada and the United States respectively. In terms of transportation, 20% of expense of Canadian was on transportation which was higher than other countries with 10% to 17%.
In contrast, people in these countries spent on health care and clothing much lower than the other categories. People in the United Kingdom spent only 1% on health care, while the figures for Canadian and Japanese was only 4% and American was 7%. Similarly, clothing accounted for 4%-6% in expense in four countries.
Top answer
The bar graphs (There is only one graph. ) compares four different nations, namely the United States, Canada, the United Kingdom, and Japan, in terms of the percentages of expense for spending on five categories including food, housing, transportation, health care and clothing in 2009. Overall, the proportions of expenditures for housing, food and transportation outnumbered (wrong word.
- The bar graphs (There is only one graph.
- ) compares four different nations, namely the United States, Canada, the United Kingdom, and Japan, in terms of the percentages of expense for spending on five categories including food, housing, transportation, health care and clothing in 2009.
- Overall, the proportions of expenditures for housing, food and transportation outnumbered (wrong word.
- Outnumbered is for countable things.
- Expense / spending / expenditure is non-count.
Get the Weekly English Kit 📬
New words, one handy idiom, and a 2-minute quiz — delivered to your inbox to keep your streak alive.
The bar graphs (There is only one graph. Granted, it has a lot of bars, but there is only one figure.) compares four different nations, namely the United States, Canada, the United Kingdom, and Japan, in terms of the percentages of expense for spending on five categories including food,
 Related Questions