
IELTS Writing Task 1 - Bar Chart - Please Review My Essay
The chart provides information about the percentage of cars used by households in Great Britain over a 36-year period, starting from 1971. Overall, there was an upward trend in the proportion of households with two cars and more than two cars, as opposed to the data for households without a car. In addition, one- car households registered the highest figure throughout the period.
In the first year of the period, the proportion of one-car households exceeded the data for households without a car by 43% at 44% and 1% respectively. Besides, the percentage for households with one car fluctuated, while the figure for households with more than two cars slightly increased to 9% in the last year of the period.
In 1971, accounting for 8%, the percentage of households with two cars experienced a gradual increase to reach 26% in 2007. In contrast, the proportion of households with no car, accounting for 48% in 1971, which decreased dramatically to the 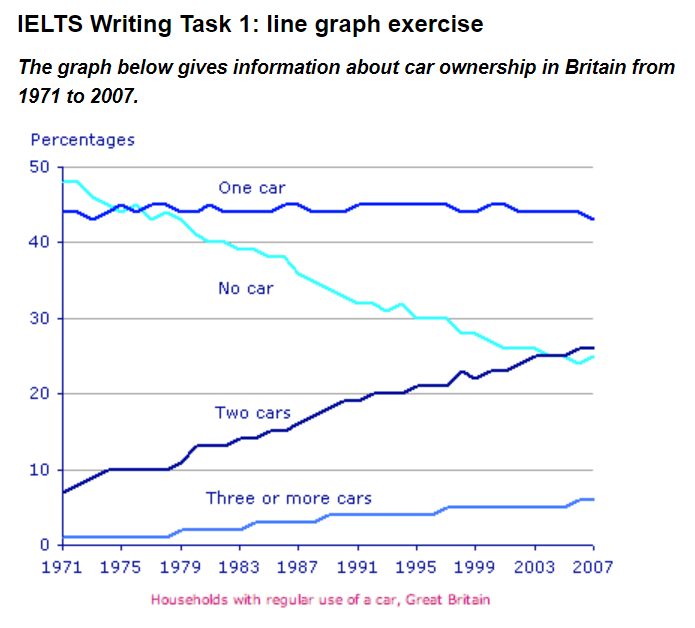
bottom at 25% at the end of the period.
Top answer
The line chart tracks how provides information about the percentage of cars used by car ownership by households in Great Britain changed over a 36-year period, starting from 1971. Overall, there was an upward trend in the proportion of households with two cars and of those with more than two cars, as opposed to the data graph for households without a ca r, which saw a steady decline . In addition, one- car households registered the highest figure were the dominant group throughout most of the period.
- The line chart tracks how provides information about the percentage of cars used by car ownership by households in Great Britain changed over a 36-year period, starting from 1971.
- Overall, there was an upward trend in the proportion of households with two cars and of those with more than two cars, as opposed to the data graph for households without a ca r, which saw a steady decline .
- In addition, one- car households registered the highest figure were the dominant group throughout most of the period.
- In the first year of the period, the proportion of one-car households exceeded the data for households without a car by 43% at 44% and 1% respectively.
- Besides, the percentage for households with one car fluctuated, while the figure for households with more than two cars slightly increased to 9% in the last year of the period.
Get the Weekly English Kit 📬
New words, one handy idiom, and a 2-minute quiz — delivered to your inbox to keep your streak alive.
The line chart tracks how provides information about the percentage of cars used by car ownership by households in Great Britain changed over a 36-year period, starting from 1971. Overall, there was an upward tren
 Related Questions