
[IELTS writing task 1 - bar chart] Please review my essay
Hi all,
I've managed to finish my IELTS essay with bar chart. Please help me to correct it.
Thank you in advance!
-------------------------------
The chart below gives information about the age of women in Australia when they gave birth to their first child in 1966, 1986 and 2006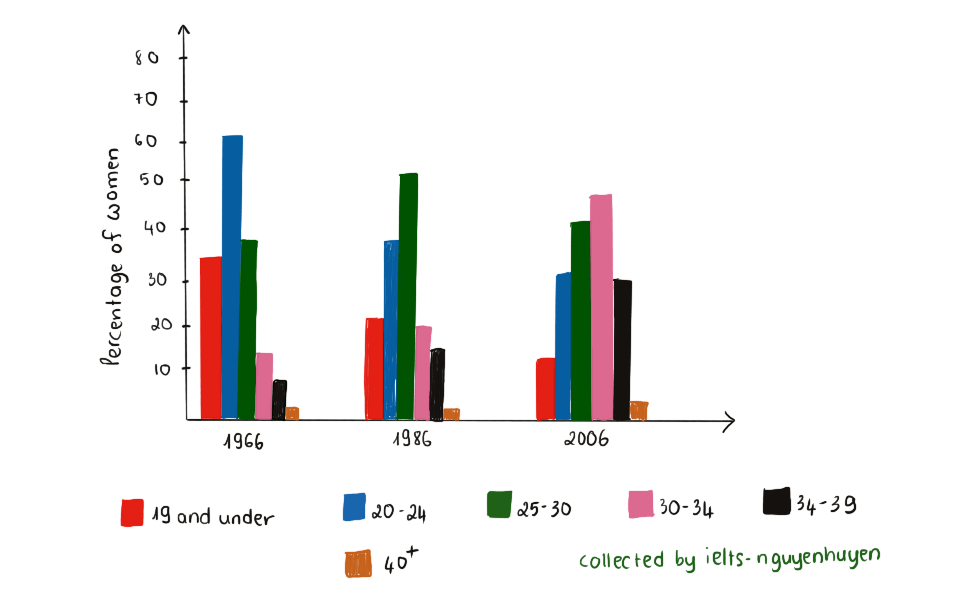
---------------
My essay:
The bar chart compares the proportion of women who gave birth to their first child in six age groups ranging from 19 to older than 40 in Australia in 1966, 1986 and 2006.
Overall, the percentage of women having the first child at the age between 30 to 39 increased, while those of the 20-24 and under 19 age group were decreased during the period. Also, women who born their first child at the age of 40 or older accounted for lowest proportion in each year.
In 1966, women aged from 20 to 24 accounted for the highest percentage with 60%, but decreased to approximately 40% and 35% in 1986 and 2006 respectively. Similarly, the percentages of women who were 19 or less than 19 years old declined from 35% in 1966 to 25% and 15% in 1986 and 2006 respectively. However, those of the 30-34 and 35-39 age group increased from 15% to 50% and from 8% to 35% respectively.
In the 25-30 age group, the percentage was 38% in 1966, but increased to 55% in 1986, which was the highest proportion in this year, then fall to 45% in 2006. Finally, those of 40 or above age group were approximately equal in 1966, 1986 and 2006, with roughly 4%.
Top answer
The bar chart compares the proportion of women who gave birth to their first child , categorized in to six age groups ranging from 19 to older than 4 0, in Australia in 1966, 1986 and 2006. Overall, the percentage of women having the ir first child at the an age between 30 to 39 increased, while those of women in the 20-24 and under 19 age group s were decreased during the period. Also, women who born bore their first child at the age of 40 or older accounted for the lowest proportion in each year.
- The bar chart compares the proportion of women who gave birth to their first child , categorized in to six age groups ranging from 19 to older than 4 0, in Australia in 1966, 1986 and 2006.
- Overall, the percentage of women having the ir first child at the an age between 30 to 39 increased, while those of women in the 20-24 and under 19 age group s were decreased during the period.
- Also, women who born bore their first child at the age of 40 or older accounted for the lowest proportion in each year.
- In 1966, women aged from 20 to 24 in their early twenties accounted for the highest percentage with ( 60% ) , but that figure decreased to approximately 40% and 35% in 1986 and 2006 respectively.
- Similarly, the percentages of women who were 19 or less than 19 years old when they had their first baby declined from 35% in 1966 to 25% and 15% in 1986 and 2006 respectively.
Get the Weekly English Kit 📬
New words, one handy idiom, and a 2-minute quiz — delivered to your inbox to keep your streak alive.
The bar chart compares the proportion of women who gave birth to their first child, categorized into six age groups ranging from 19 to older than 40, in Australia in 1966, 1986 and 2006.
Overall, the percentage
 Related Questions