
[IELTS Writing Task 1] BAR CHART - Oil production capability of six nations
Hi everyone,
This is my work on an IELTS Writing Task 1 thread. Please help me assess the writing. You can point at the grammar errors, vocabulary disorders and misunderstandings, or anything that can probably lower my IELTS Writing score. Finally, please show an IELTS Writing score which is, in your opinion, closest to my work.
I will be really grateful for your helps.
Thank you.
(the task has been given as a JPEG image file attached to this article)
(below is my writing)
The bar chart illustrates the amounts of oil produced by six countries during the period from 1990 to 2010.
At first glance it is clear that the productivity of most of the nations gradually increased over time, except for Qatar’s figure fluctuating throughout the given period.
From 1990 to 2010, Saudi Arabia had the highest quantity of oil produced among six given countries, with the figure in 1990 and 2010 was around 8.5 and 14.5 million barrels per day respectively. There is a surge in Saudi Arabia’s 2000 and 2005 figure, when the amount of oil produced sharply jumped from just over 9 million to about 12 million of barrel per day. This nation also held the highest growth rate comparing to the other five countries, with 6 million of barrel over two decades.
Iran, Iraq, Kuwait and UAE shared a same steady rise in common, from about 2 million to 4 million barrels during this period. Qatar’s quantity, however, far different from other countries with the top figure is nearly 1 million of barrel per day in 2000. This nation also witnessed a fluctuation of oil production capability throughout the period.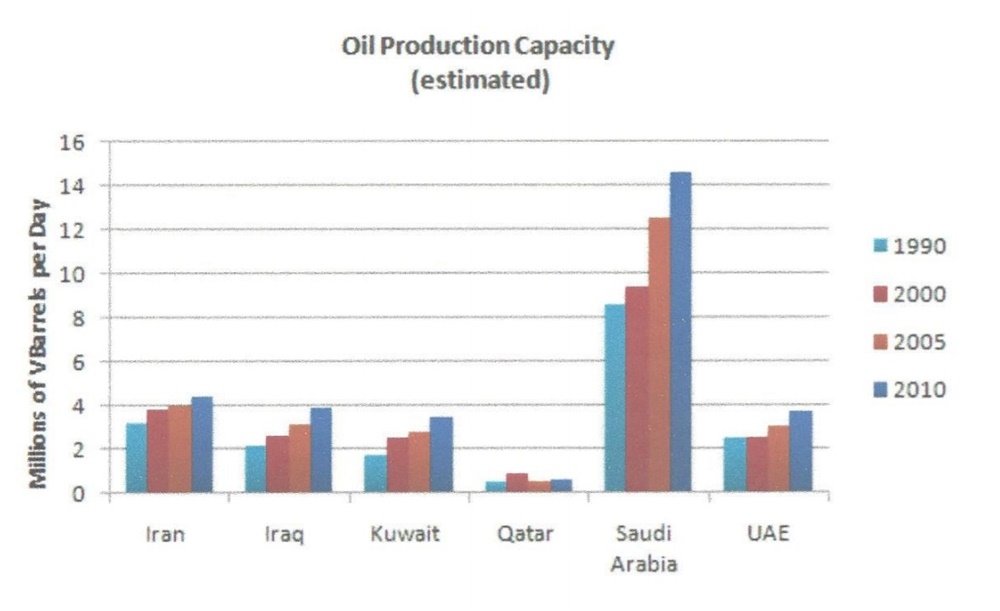
Top answer
), and if you can, please give an IELTS Writing band score that fits this work. Thank you so much. OIL PRODUCTIVITY The bar chart illustrates the amounts of oil produced by six countries during the period from 1990 to 2010.
- ), and if you can, please give an IELTS Writing band score that fits this work.
- Thank you so much.
- OIL PRODUCTIVITY The bar chart illustrates the amounts of oil produced by six countries during the period from 1990 to 2010.
- At first glance it is clear that the productivity of most of the nations gradually increased over time, except for Qatar’s figure fluctuating throughout the given period.
- 5 million barrels per day respectively.
Get the Weekly English Kit 📬
New words, one handy idiom, and a 2-minute quiz — delivered to your inbox to keep your streak alive.
The bar chart illustrates the amounts of oil produced by six countries during the period from 1990 to 2010. (Which countries? Which time points? -- It is not a line graph! WHat are the units of measurement? Your first paragraph is not complete.)
At first glance it is clear that (That does not do anything to describe the figure. Also words like "clear, obvious, evide
 Related Questions