
IELTS WRITING TASK 1 BAR CHART
PLEASE EVALUATE MY WRITING! THANK YOU SO MUCH.
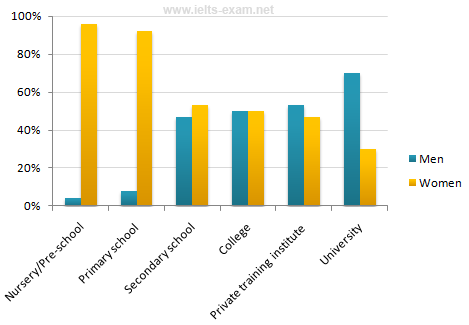
The chart below shows the percentage of male and female teachers in six different types of educational setting in the UK in 2010.
Summarise the information by selecting and reporting the main features, and make comparisons where relevant.
The bar chart shows the gender distribution of teachers in a range of educational institutions in the UK in the year 2010.
Overall, it is evident that while lower levels of education were female-dominated, higher levels of education saw a significant presence of male teachers.
In three educational settings for children up to 11 years old (nursery, elementary school, middle school), females outnumbered males. Women made up a particularly large proportion of the teacher group in pre-school and primary school, with males accounted for only approximately 3% in the former and around 5% in the latter. The gender gap in secondary school was narrowed as the figures for male teachers and female teachers were around 45% and 55%, respectively.
Males and females were equally represented in college as each comprised 50%. The number of male teachers overtook that of female teachers in private training institute with the same gap in secondary school. With regard to university, there were over twice as many male teachers as female teachers.
Top answer
The bar chart shows the ratios of male to female gender distribution of teachers in a range of educational institutions in the UK in the year 2010. ) while lower levels of education were female-dominated, higher levels of education saw (Levels are inanimate objects. ) had a significant presence of male teachers.
- The bar chart shows the ratios of male to female gender distribution of teachers in a range of educational institutions in the UK in the year 2010.
- ) while lower levels of education were female-dominated, higher levels of education saw (Levels are inanimate objects.
- ) had a significant presence of male teachers.
- In three educational settings for children up to 11 years old (nursery, elementary school, middle school), females outnumbered males.
- Women made up a particularly large proportion of the teacher group in pre-school and primary school, with males accounted (wrong verb form) for only approximately 3% in the former and around 5% in the latter.
Get the Weekly English Kit 📬
New words, one handy idiom, and a 2-minute quiz — delivered to your inbox to keep your streak alive.
The bar chart shows the ratios of male to female gender distribution of teachers in a range of educational institutions in the UK in the year 2010. (How many institutions?)
Overall, it is evident that ( I see that you did not read my advice posts, did you?) while lower levels of education were femal
Sample essay
The bar chart compares the relative numbers of men and women teachers for six different types or levels of schooling in the UK in 2010. They cover the complete range from nursery school to university.
Overall, women predominate in three of the six levels, nursery, primary and secondary school, whereas men represent a higher percentage of the faculty in privat
 Related Questions