
IELTS writing task 1 bar chart
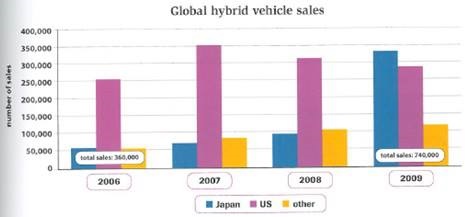
The given bar chart illustrates the turnover of vehicles that use petrol and electricity in Japna, America, and other regions from 2006 to 2009.
Overall the sales of hybrid vehicles experienced upwards trends in the three mentioned areas and doubled over the period. It is clear that Japan gained the biggest growth while America had the largest sales.
In Japan, the number of vehicles sold was approximately 51000 in 2006. This figure rose slightly to nearly 100000 in 2008 and then soared to around 330.000 in the next year. For the American market, sales started at over 250000 in 2006, then the number went up to 350000 in 2007, and feel to 2800 in the next two-year. In other parts of the world, turnover was the same as that of Japan in 2006 about 51000, it increased slightly to approximately 80000in 2007, and continued to rise over 100000 in 2008. Finally, the figure reached around 130000 in 2009.
Top answer
The given bar chart illustrates the turnover of vehicles (incorrect. ) that use petrol and electricity in Japna , America, and other regions from 2006 to 2009 . ) Overall the sales of hybrid vehicles increased experienced (Do not use anthropomorphic verbs - see, experience, witness - in Task 1.
- The given bar chart illustrates the turnover of vehicles (incorrect.
- ) that use petrol and electricity in Japna , America, and other regions from 2006 to 2009 .
- ) Overall the sales of hybrid vehicles increased experienced (Do not use anthropomorphic verbs - see, experience, witness - in Task 1.
- These are not appropriate for a math / science context.
- ) upwards trends in the three mentioned areas (not good.
Get the Weekly English Kit 📬
New words, one handy idiom, and a 2-minute quiz — delivered to your inbox to keep your streak alive.
The given bar chart illustrates the turnover of vehicles (incorrect. That is not what is plotted.) that use petrol and electricity in Japna, America, and other regions from 2006 to 2009. (Imprecise.)
Overall the sales of hy
 Related Questions