
IELTS WRITING TASK 1 - BAR CHART
Dear AlpheccaStars,
Please help me by reviewing this report. I've been posting quite many reports to this forums and received such constructive comments and useful feedback from you. In case you recognize my pieces of writing, can you tell me whether there were any improvements? In the case that you do not have free time, so it's totally fine if you just give feedback on this report only. Many thanks.
TASK 1: The bar chart below shows the top ten countries for the production and consumption of electricity in 2014.
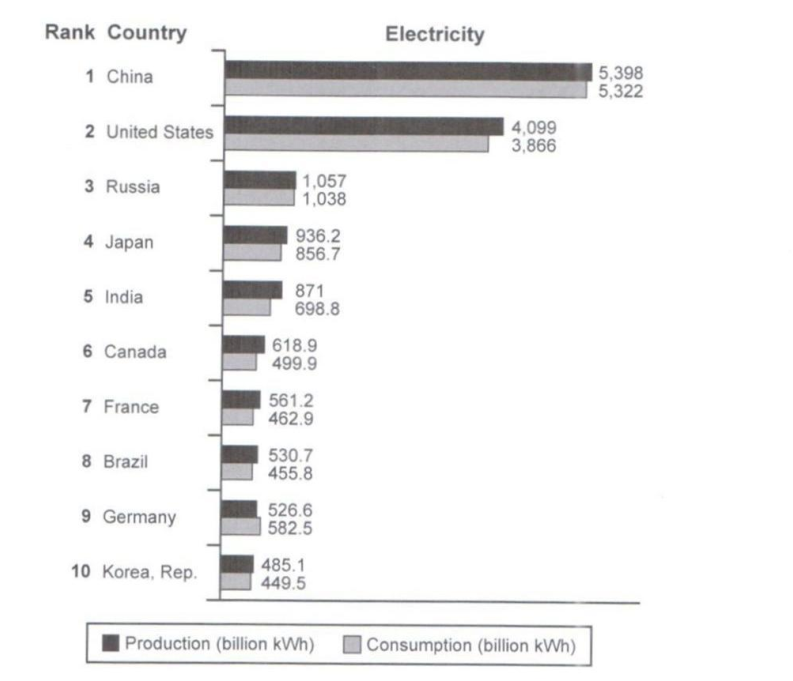
The bar chart shows the amount of electricity produced and consumed by ten countries in 2014. Overall, China was the leading region for producing and consuming electricity whereas the figure for Korea, Rep was smallest.
The amount of electricity generated and consumed in China was equally highest, about 5,398 billion kWh and 5,322 billion respectively, followed by the United States with 4,099 billion kWh produced and 3,866 billion kWh used. Russian and Japan ranked third and fourth with around 1,000 billion kWh produced and consumed while the corresponding figures for India and Candana were relatively lower, just 871 billion generated and 698.8 billion used compared to 618.9 billion produced and 499.9 billion consumed respectively.
Though the amount of electricity production and consumption in Korea was lowest, about 485.1 billion and 449.5 billion, the figures for France, Brazil, and German were slightly higher. German was the only country consumed electricity more than that was produced, 582.5 billion kWh in comparison with 526.6 billion.
162 words.
Top answer
The bar chart shows the amount of electricity produced and consumed by ten countries in 2014. ) for producing and consuming electricity whereas the figure for Korea, Rep (write the entire country's name) was smallest. (China topped the chart, being the largest producer and consumer, and ...
- The bar chart shows the amount of electricity produced and consumed by ten countries in 2014.
- ) for producing and consuming electricity whereas the figure for Korea, Rep (write the entire country's name) was smallest.
- (China topped the chart, being the largest producer and consumer, and ...
- ) The amount of electricity generated and consumed in China was equally highest, (You already said this.
- Avoid repetition.
Get the Weekly English Kit 📬
New words, one handy idiom, and a 2-minute quiz — delivered to your inbox to keep your streak alive.
The bar chart shows the amount of electricity produced and consumed by ten countries in 2014. (The bars are ordered by production, with the largest producers at the top.) Overall, China was the leading region (China is not a region.) for producing and consuming electricity whereas the figure for
Punctuation mark wrong
Uses of
................,while........... .
 Related Questions