
IELTS writing task 1: Adult education.
The charts below show the result of a survey of adult education. The first chart shows the reason why adults decide to study. The pie chart shows how people think the costs of adult education should be shared.
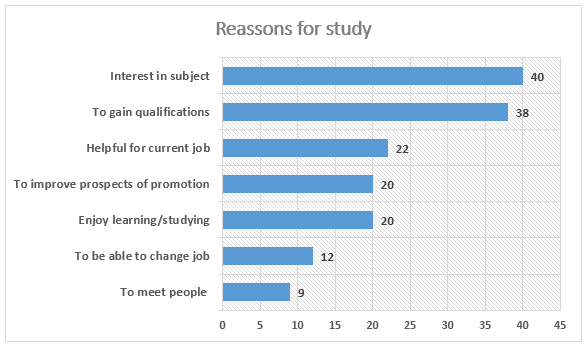
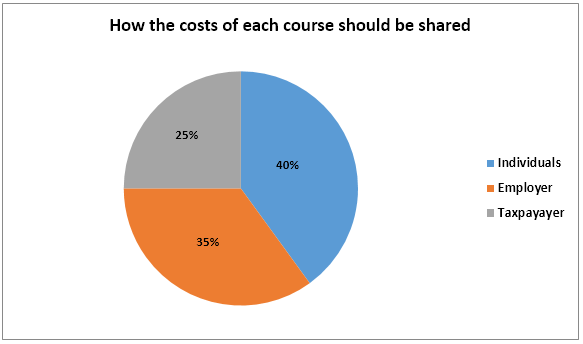
The charts illustrate information about adult education. The bar chart describes the motives of adults to pursue scholarship. The pie chart provides data on people’s opinion about how the fee of education should be paid.
In general, most students choose to study because of their personal interest and they should be supported in paying educational fee.
It can be seen from the bar graph, 40% of students decide to learn because they are fond of the subject. The following reason is achieving certificates with 38%. In addition, the least popular reasons are socializing and shifting jobs accounting for 9% and 12% respectively. Data for other motives such as obtaining promotion, being better at current job and finding the joy in learning is approximately 20%.
As can be withdrawn from the pie chart, public believe that scholars only ought to be responsible for less than 50% of the cost, whereas taxpayer and employer should share the expense, with 25% for the former and 35% for the later.
Top answer
ngothanhnam2211 The charts below show the result of a survey of adult education. The first chart shows the reason why adults decide to study. The pie chart shows how people think the costs of adult education should be shared.
- ngothanhnam2211 The charts below show the result of a survey of adult education.
- The first chart shows the reason why adults decide to study.
- The pie chart shows how people think the costs of adult education should be shared.
- 1 The charts illustrate information about adult education.
- The bar chart describes the motives of adults to pursue *scholarship (studies).
Get the Weekly English Kit 📬
New words, one handy idiom, and a 2-minute quiz — delivered to your inbox to keep your streak alive.
It wasn't clear to me from the chart if the numbers are total responses by participants in the survey or percentages. Maybe that was intentional.
The only concern is using the word "public" in the last paragraph if it was only a small survey. People might be a better word.
! Good use of special vocabulary.
The charts illustrate information about adult education. (That is not correct. There is no illustration, or picture. "The charts contain information gathered from a survey on adult education.")
The bar chart describes the motives of adults to pursue scholarship. (wrong synonym. A scholarship is usually an award given to a
If you go to this website, sign up for the e-mail newsletter, you can do practice essays and ask questions about model answers online afterwards. This week's essay:
http://ieltsliz.com/ielts-table-spending-on-items/
Other tips:
 Related Questions