
IELTS Writing Task 1
The graph below gives information about the sales of the three most commonly
purchased items in a particular bakery for the year 2014.
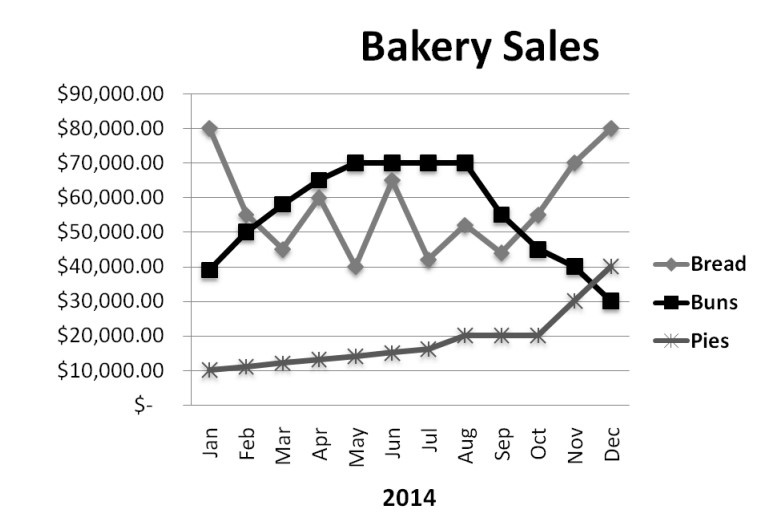
The line graph compares the sales of the three most popular goods in a bakery in 2014.
Overall, the sales of bread in December was exactly the same as that in January. While pies sales declined and buns sales had an upward trend.
In January, the sales of bread was $80000, which was double the sales of buns and 8 times higher than that of pies. However, this number dropped considerably to around $45000 in March. From then, bread sales fluctuated between $45000 and $65000 but still remained lower than buns sales until September, when it climbed back and finished at the same amount as January.
The sales of buns was $40000 at the beginning of the year. This figure rose significantly to $70000 in May and remained the same until August, after which it fell to only $30000 in December. Meanwhile, the sales of pies was the lowest for most of the times during the period. It started at $10000 in January and increased slightly to reach $20000 in August. Sales then doubled to $40000 and became higher than buns sales in December.
Top answer
The line graph compares the monthly sales of the three most popular goods , bread, buns and pies, in a bakery in 2014. Overall, the sales of bread in December was exactly the same as that in January. (That is not a "main feature".
- The line graph compares the monthly sales of the three most popular goods , bread, buns and pies, in a bakery in 2014.
- Overall, the sales of bread in December was exactly the same as that in January.
- (That is not a "main feature".
- It is a rather trivial detail.
- ) While pies sales declined and buns sales had an upward trend.
Get the Weekly English Kit 📬
New words, one handy idiom, and a 2-minute quiz — delivered to your inbox to keep your streak alive.
The line graph compares the monthly sales of the three most popular goods, bread, buns and pies, in a bakery in 2014.
Overall, the sales of bread in December was exactly the same as that in January. (That is not a "main feature". It is a rather trivial detail. Put only the most importa
 Related Questions