
IELTS Writing Task 1
Please check my report if you have time. Thank you in advance.
Question:
The charts below give information about USA marriage and divorce rates between 1970 and 2000, and the marital status of adult Americans in two of the years.
Answer:
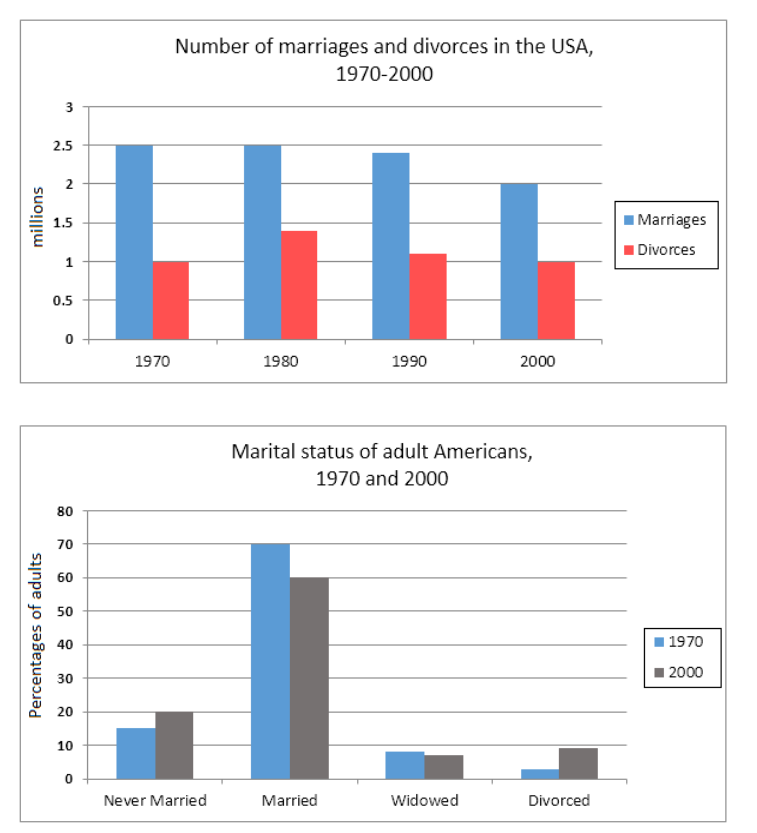
The first bar graph shows the changes in the number of marriages and divorces in the USA from 1970 to 2000, and the second bar graph gives information about the marital status of American adults in the 2 years: 1970 and 2000.
Overall, the number of marriages decreased slightly over the shown period, while the figure for divorces saw minimal changes. Additionally, married adults accounted for the largest proportion in both the first and last year.
In 1970, there were 1 million divorces in the USA, while there were more than twice as many marriages. Moreover, the number of marriages remained unchanged in 1980 and dropped to 2 million by 2000. In contrast, the figure for divorces peaked at nearly 1.5 million in 1980 before falling back to 1 million in 2000.
In 1970, the proportion of married American adults were around 70%, which fell to just below 60% by 2000. While the figures for divorcees and adults that were never married both increased by around 7%, the proportion of widowed adults decreased slightly.
Top answer
The first bar graph shows the changes in the (Incorrect. g. + 5%.
- The first bar graph shows the changes in the (Incorrect.
- g.
- + 5%.
- It plots the actual numbers.
- ) number of marriages and divorces in the USA from 1970 to 2000, and the second bar graph gives information about the (Vague, not precise) marital status of plots the percentage of American adults in four categories of marital status in the 2 years: 1970 and 2000.
Get the Weekly English Kit 📬
New words, one handy idiom, and a 2-minute quiz — delivered to your inbox to keep your streak alive.
The first bar graph shows the changes in the (Incorrect. It does not plot the changes, e.g. + 5%. It plots the actual numbers. ) number of marriages and divorces in the USA from 1970 to 2000, and the second bar graph gives information about the (Vague, not precise) marital status of plots the percentage of
Example essay:
Paragraph 1: Describe the figure completely.
The two bar charts together give information about marriage and divorce in the USA. The first chart plots the numbers of marriages and divorces in four years, 1970, 1980, 1990 and 2000. The second bar chart plots the proportion of adults who were in each of four categories ( never married, married, widowed
 Related Questions