
IELTS Writing Task 1
Question:
Answer:
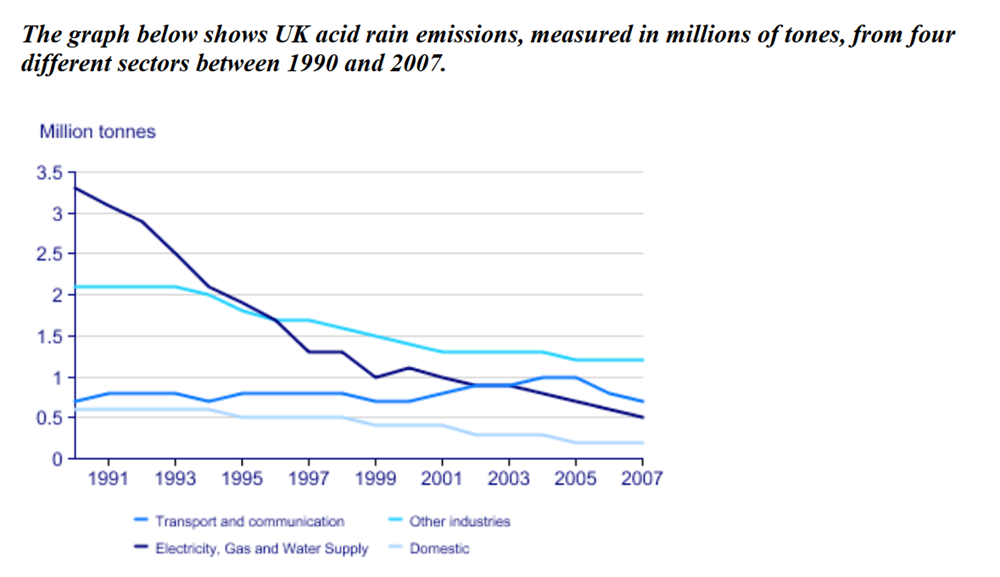
The line graph compares the amount of acid rain emissions produced by 4 different sectors from 1990 to 2007 in the UK.
Overall, the amount of acid rain emissions in the UK decreased dramatically over the period shown. Also, the electricity, gas and water supply sector experienced the most significant change.
In 1991, the electricity, gas and water supply sector produced the highest amount of acid rain emissions in the UK, which was around 3.25 million tonnes. In the same year, the figures for the transport and communication sector and the domestic sector were both just over 0.5 million tonnes, while other industries are responsible for over 2 million tonnes of emissions.
In 2007, the amount of emissions that came from electricity, gas, and water supply dropped considerably to around 0.5 million tonnes. While the figures for the domestic sector and other industries experienced a gradual decrease, the transport and communication sector went up slightly in the amount of emissions, peaking at around 1 million tonnes in 2005.
Top answer
htm
- htm
Get the Weekly English Kit 📬
New words, one handy idiom, and a 2-minute quiz — delivered to your inbox to keep your streak alive.
 Related Questions