
IELTS WRITING TASK 1
The first chart below gives information about the money spent by British parents on their children’s sports between 2008 and 2014. The second chart shows the number of children who participated in three sports in Britain over the same time period.
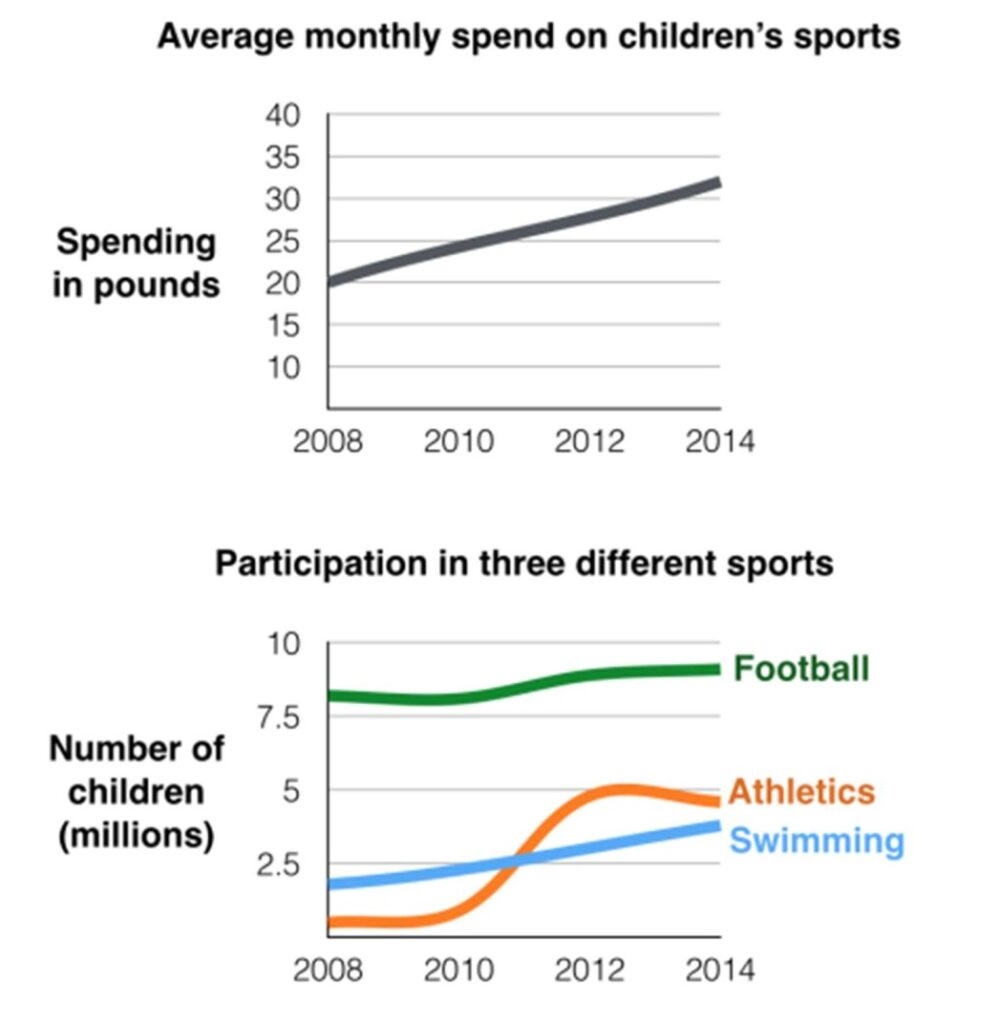
The line charts compare figures for expenditure on sports and attendance of children in three different sports in Britain from 2008 to 2014.
Overall, the amount of money spent on sport and participation of children all followed an upward trend over the period. Moreover, football registered the highest data compared to two other sports.
A closer look at the first line chart reveals that the statistic started from 20 pounds in 2008 and proliferated to over 30 pounds in the end of the timescale. Turning to the second graph, football recorded a noticeable figure, 8 million participants, which increased by 1 million in 2014.
In terms of Athletics and Swimming, both stayed at one and two million at the starting point. After the intersection in 2011, Athletics surged to 5 million, 2 million higher than the figure for Swimming (3 million) in the following year. Finally, both ended the time frame with 4 million for Swimming and around 5 million for Athletics.
(162 words)
Please help me. Thank you very much
Top answer
The line charts compare figures for e xpenditure on sports and attendance participation of children in three different sports in Britain from 2008 to 2014. Overall, the amount of money spent on sport and participation of children all both followed an upward trend over the that period. Moreover, football registered had the highest data rate of participation compared to swimming or athletics.
- The line charts compare figures for e xpenditure on sports and attendance participation of children in three different sports in Britain from 2008 to 2014.
- Overall, the amount of money spent on sport and participation of children all both followed an upward trend over the that period.
- Moreover, football registered had the highest data rate of participation compared to swimming or athletics.
- two other sports .
- [ 1 ] A closer look at the first line chart reveals that the statistic Spending started from at £ 20 pounds in 2008 and [ 2 ] proliferated rose in a linear manner to over £ 30 pounds in [ 3 ] by the end of the given period.
Get the Weekly English Kit 📬
New words, one handy idiom, and a 2-minute quiz — delivered to your inbox to keep your streak alive.
The line charts compare figures for expenditure on sports and attendance participation of children in three different sports in Britain from 2008 to 2014.
Overall, the amount of money spent on sport and participation of children all
 Related Questions