
IELTS WRITING TASK 1
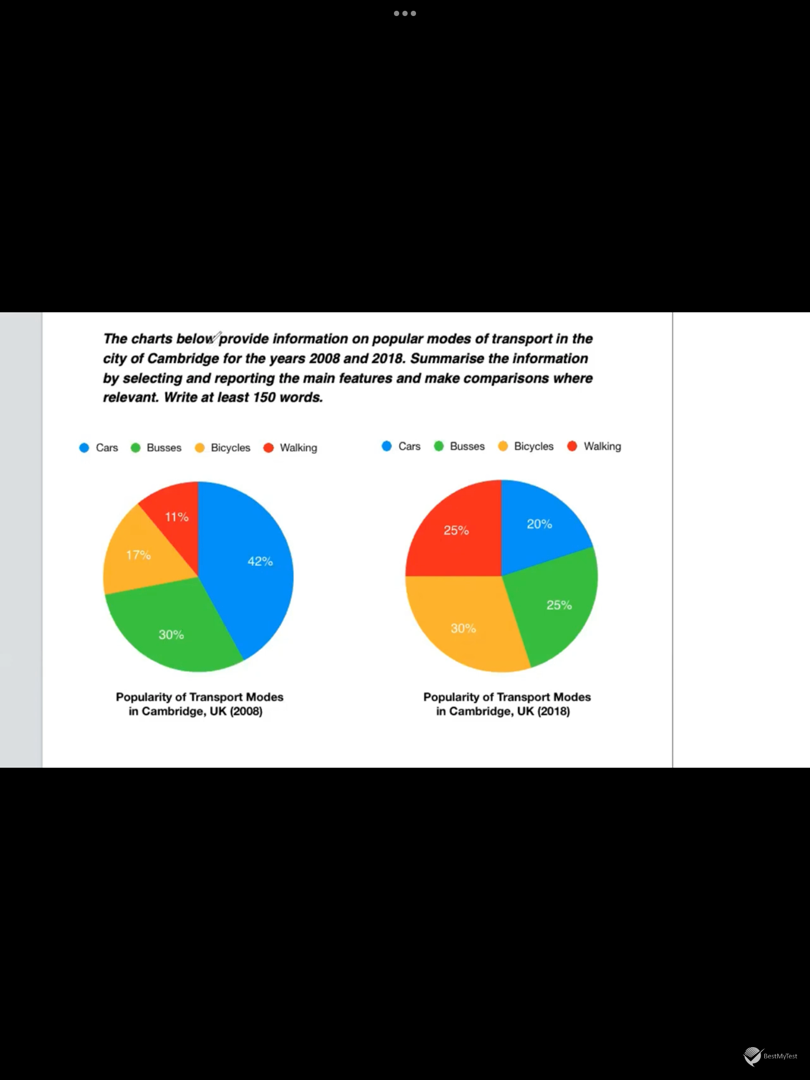
The two pie charts illustrate the popularity of four means of transport:cars, busses, bicycles and walking in Cambridge city in 2008 and 2018.
Overall, the general trend for cars and busses was to decrease after 10-year period while the figures for bicycles and walking experienced an upward trend.
Regarding the motorised vehicles, in 2008, cars were the most common mode of transportation in Cambridge, accounting for 42% in total. However, the figure for it had witnessed a sharp decrease, to about one fifth of the graph. Beside, the second largest feature of the chart were made up by busses, with 30% in popularity in 2008. Then, since 2018, there had been a slight decline of 5% in the common of this type of vehicle.
In contrast, just only 11% people in Cambridge city went on foot in 2008. But then, the figure for walking had experienced more than a twofold increase, which made up the same level in popularity as busses by 2018. In addition, the graph for bicycles comprised about 17% in 2008. After that, a growth of 13% was seen in its popularity that made bicycles become the most popular vehicles in 2018.
Top answer
The two pie charts illustrate the popularity of four means of transport: c ars, busses, bicycles and walking in Cambridg e city in 2008 and 2018. Overall, the general trend for popularity of cars and busses was to decrease d after 10-year over that perio d, while the figures for bicycles and walking experienced an upward trend. Regarding the motorised vehicles, I n 2008, cars were the most common mode of transportation in Cambridge, accounting for 42% in of the total.
- The two pie charts illustrate the popularity of four means of transport: c ars, busses, bicycles and walking in Cambridg e city in 2008 and 2018.
- Overall, the general trend for popularity of cars and busses was to decrease d after 10-year over that perio d, while the figures for bicycles and walking experienced an upward trend.
- Regarding the motorised vehicles, I n 2008, cars were the most common mode of transportation in Cambridge, accounting for 42% in of the total.
- However, the figure for it had witnessed a sharp decrease, to about half the original ten years later.
- one fifth of the graph.
Get the Weekly English Kit 📬
New words, one handy idiom, and a 2-minute quiz — delivered to your inbox to keep your streak alive.
The two pie charts illustrate the popularity of four means of transport: cars, busses, bicycles and walking in Cambridge city in 2008 and 2018.
Overall, the general trend for popularity of cars and busses was to decrease
 Related Questions