
IELTS WRITING TASK 1
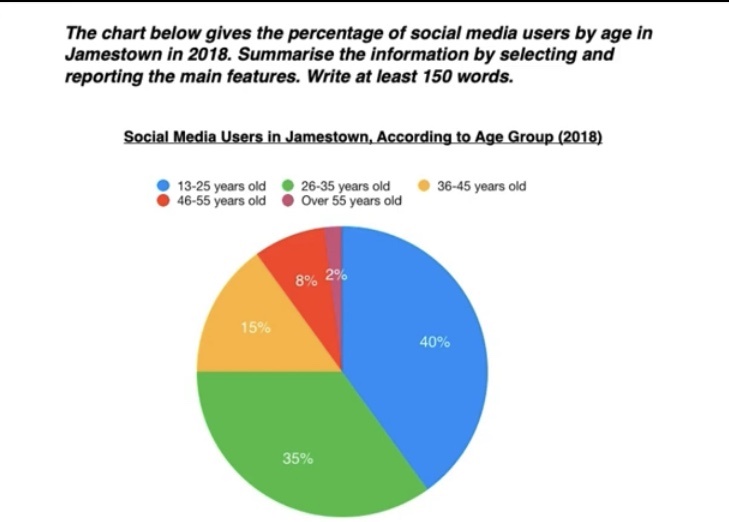
The pie chart compares the proportion of digital networking users of five age groups in Jamestown in the year 2018.
Overall, the chart showed a general trend in Jamestown that the older the people were, the more likely they use less digital platforms.
Regarding the most significant feature of the graph, the figure for people aged 13 to 25 was the highest, which accounted for 40% of total. Next to that, with slightly lower proportion, about 35% of people from 26 to 35 years old used social media. When added together, those two age groups made up three quarters of digital networking users in Jamestown.
In contrast, there were only 2% of people over 55 years of age using social media. Following that pattern, users from 46 to 55 years old and 36 to 45 years old constituted 8% and 15% respectively. In addition, it is noticeable that users aged over 36 collectively made up 25% of the total.
Top answer
The pie chart compares the proportio n s of digital o nline so cial media networking users of in five age groups in Jamestown in the year 2018. Overall, the chart sho w s ed a general trend in Jamestown that the older the people were, the more less likely they were to use less digital such online platforms. Regarding the most significant feature of the graph, the figure for people aged 13 to 25 was the highest, which accounted for 40% of the total.
- The pie chart compares the proportio n s of digital o nline so cial media networking users of in five age groups in Jamestown in the year 2018.
- Overall, the chart sho w s ed a general trend in Jamestown that the older the people were, the more less likely they were to use less digital such online platforms.
- Regarding the most significant feature of the graph, the figure for people aged 13 to 25 was the highest, which accounted for 40% of the total.
- Next to that, with a slightly lower proportion, about 35% of people from 26 to 35 years old used social media.
- When added together, those two age groups made up three quarters of the entire chart.
Get the Weekly English Kit 📬
New words, one handy idiom, and a 2-minute quiz — delivered to your inbox to keep your streak alive.
The pie chart compares the proportions of digital online social media networking users of in five age gro
 Related Questions