
IELTS WRITING TASK 1
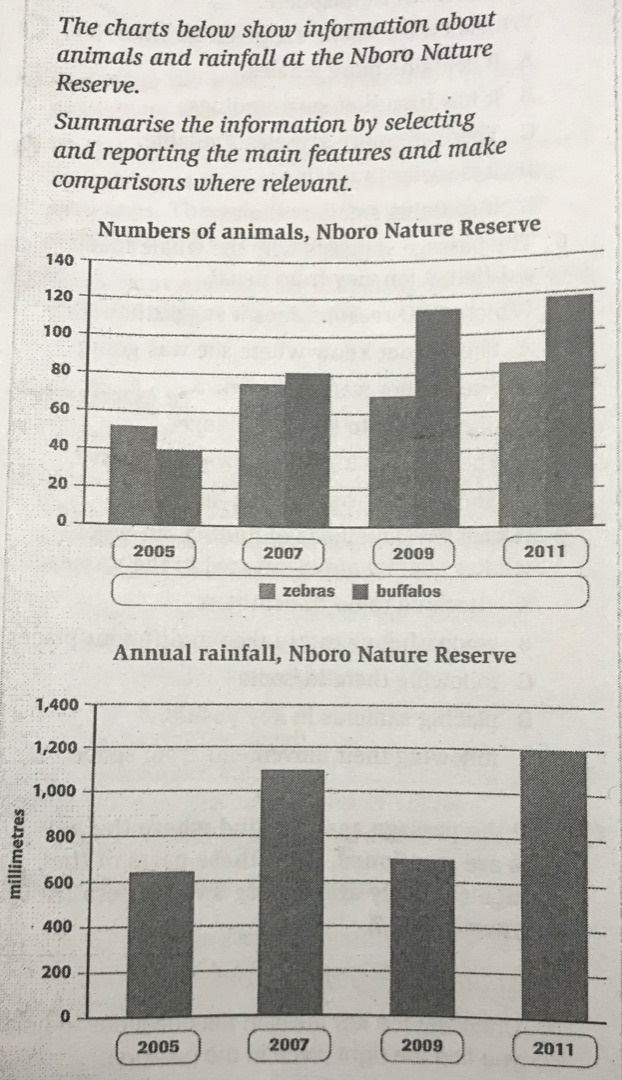
The first chart illutrates the numbers of zebras and buffaloes while the second charts depicts the amount of rainfall, in millimetres, at the Nboro Nature Reserve from 2005 to 2011.
Overall, the figure for buffaloes experienced an upward trend throughout the period, whereas there appears to be a correlation between the number of zebras and rainfall.
In 2005, there were more zebras than buffaloes with 50 compared to 40 respectively. However, after that, the buffaloes outnumbered the zebra in most years, and reaching its highest point of nearly 120, which is almost trible those at the beginning of the period. Beside, the number of zebras fluctuated for the subsequent six years, and then stood at more than 80.
During the same period, the amount of rainfall at Nboro Nature Reserve started at around 650 millimetres in 2005. Then, the figure witnessed a sharp increase, to about 1100 millimetres of rainfall by 2007. Nevertheless, in 2009, it dropped dramatically to the relatively same level as it was in 2005 before recovering significantly to 1200 millimetres of rainfall in the end of the period. Obviously, when there was more rainfall, there were more zebras.
Top answer
Double posted.
- Double posted.
Get the Weekly English Kit 📬
New words, one handy idiom, and a 2-minute quiz — delivered to your inbox to keep your streak alive.
 Related Questions