
IELTS WRITING TASK 1
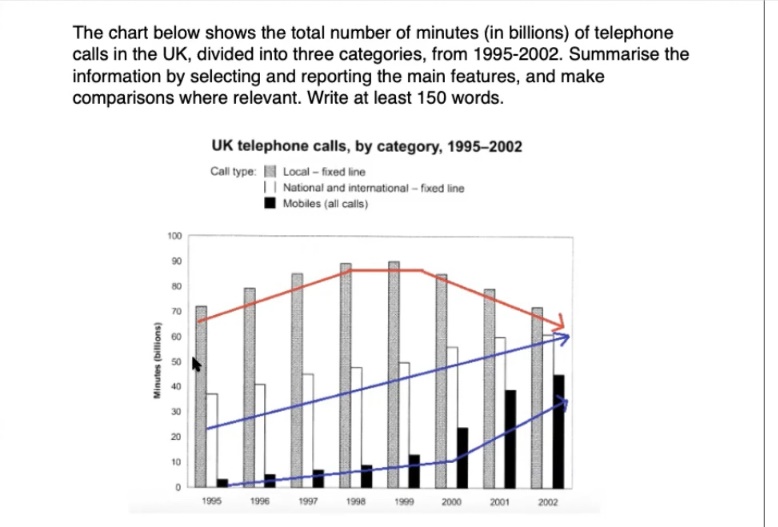
The chart illustrates the total number of telephone calls in the UK in billions of minutes, with three call types between 1995 and 2002.
Overall, local fixed line calls reached a peak by the middle of the period, and then decreased slightly until 2002, while both national and international fixed line calls and mobile calls experienced an upward trend over the whole period.
With regard to local fixed line calls, in 1995, they began at over 70 billion minutes and continued to increase gradually for the subsequent 4 years to the highest point of 90 billion minutes by 1999. However, towards the end of the period, there was a dip in minutes of call, ending in 2002 at the same amount as it was in 1995.
Turning to national and international fixed line calls along with mobiles calls, mobiles calls stood at 2 billion minutes in 1995. After that, they witnessed a gradual growth, with a marked increase in number of minutes call from 2000 to 2002. National and international fixed line calls also showed the same pattern, starting at just under 40 billion minutes in 1995, then rising marginally to around 60 billion minutes in 2002.
Top answer
The chart illustrates compares three types of telephone call in terms the total [ 1 ] number duration in billions of minutes of telephone calls in the UK in billions of minutes, with three call types between 1995 and 2002. Overall, local fixe d-l ine calls reached a dominated throughout that period and peak ed by the middle of it, the period, and then decreased slightly until 2002, while both national and international fixe d-l ine calls and mobile calls experienced an upward tren d. over the whole period.
- The chart illustrates compares three types of telephone call in terms the total [ 1 ] number duration in billions of minutes of telephone calls in the UK in billions of minutes, with three call types between 1995 and 2002.
- Overall, local fixe d-l ine calls reached a dominated throughout that period and peak ed by the middle of it, the period, and then decreased slightly until 2002, while both national and international fixe d-l ine calls and mobile calls experienced an upward tren d.
- over the whole period.
- With regard to local fixed line calls, I n 1995, they local fixed-line calls began at over 70 billion minute s, and that figure continued to increase gradually for the subsequent [ 2 ] four years to the highest point of 90 billion minutes by 1999.
- However, towards the end of the period, there was a dip in minutes of call, decline afterwards, with the graph ending in 2002 at the same amount level as it was in 1995.
Get the Weekly English Kit 📬
New words, one handy idiom, and a 2-minute quiz — delivered to your inbox to keep your streak alive.
The chart illustrates compares three types of telephone call in terms the total [ 1] number duration in billions of minutes of telephone calls in the UK in billions of minutes, with three call types between 19
 Related Questions