
IELTS WRITING TASK 1.
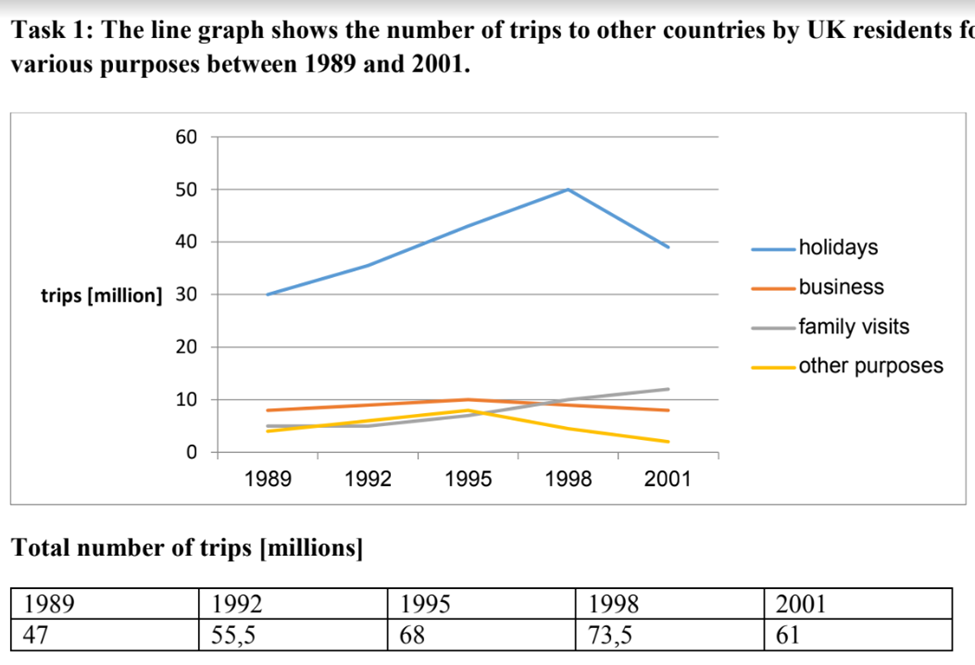
The line graph compares the number of travels to other nations by UK residents for four reasons: holidays, businesses, family visits and other purposes from 1989 to 2001, whereas the table depicts its total.
Overall, while holidays became the most popular purpose of travelling throughout the given span, very few trips were made for other purposes compared to others. Additionally, the total number of trips constantly grew despite a slight drop in the last three years.
Regarding the line graph, travels for other reasons and businesses witnessed a mostly identical trend over 12 years. Between 1989 and 1995, both figures rose by approximately 3 million, prior to declining constantly during the remaining years.
Starting with 30 million in 1989, the number of holidays trips soared inexorably to 50 before falling to 39 million in 2001. Whereas, the figure for family visits remained at five between 1989 and 1992, after which it grew gradually and reached approximately 12 in 2001.
As for the table, the total number of trips were on an increase throughout a nine-year span and peaked at 73.5 in 1998, making it the year with the highest amount of travel ever. During three years later, the figure declined to 61.
Get the Weekly English Kit 📬
New words, one handy idiom, and a 2-minute quiz — delivered to your inbox to keep your streak alive.
 Related Questions