
IELTS WRITING TASK 1
The chart below gives information about science qualifications held by people in two countries.
Summarise the information by selecting and reporting the main features, and make comparisons where relevant.
The given graph reveals the proportion of Malaysian and Singaporian holding 4 different genres of science qualifications.
Overall, it is apparent that the figures for people without a qualification in science in both countries are the highest, while the opposite is true for the percentage of people who hold a master’s degree. Also noteworthy is that the percentage of people with master's degrees in both countries tends to be similar.
Regarding Malaysia, about 65% of people do not have a science qualification, which is the highest, followed by 35% of people with school leaving exams. Meanwhile, the figures for people who hold a bachelor's degree and master's degree are 10% and 5% respectively.
Moving on to Singapore, the percentage of people without a science qualification is 60% while the figure for people graduated with a master's degree is 5%, which is the lowest. Additionally, the proportion of people who have school leaving exams is 30%, in comparison with 20% of people who graduated as bachelor. 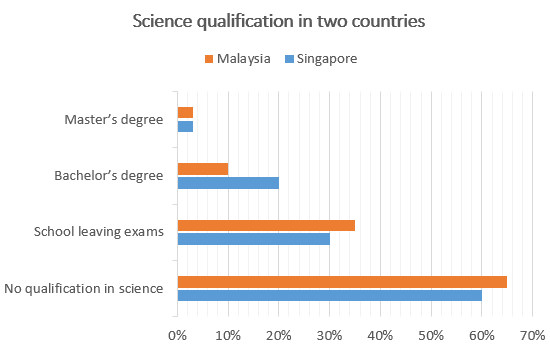
Top answer
This task makes no sense. The values are inconsistent. Do not use defective practice tests like this one.
- This task makes no sense.
- The values are inconsistent.
- Do not use defective practice tests like this one.
- If the values are nonsensible, do not attempt writing the essay at all.
- Trang Nguyen 8417 The given graph reveals the proportion of Malaysian and Singaporian holding 4 different genres of science qualifications.
Get the Weekly English Kit 📬
New words, one handy idiom, and a 2-minute quiz — delivered to your inbox to keep your streak alive.
This task makes no sense. The values are inconsistent.
Do not use defective practice tests like this one. If the values are nonsensible, do not attempt writing the essay at all.
Trang Nguyen 8417Thegivengraph reveals the proportion of Malaysian and
 Related Questions