
IELTS WRITING TASK 1
A glance at the graph provided reveals some striking similarities between changes in the price of three different commodities from 1978 to 2009. The graph also illustrates the general trend of consumer-price index.
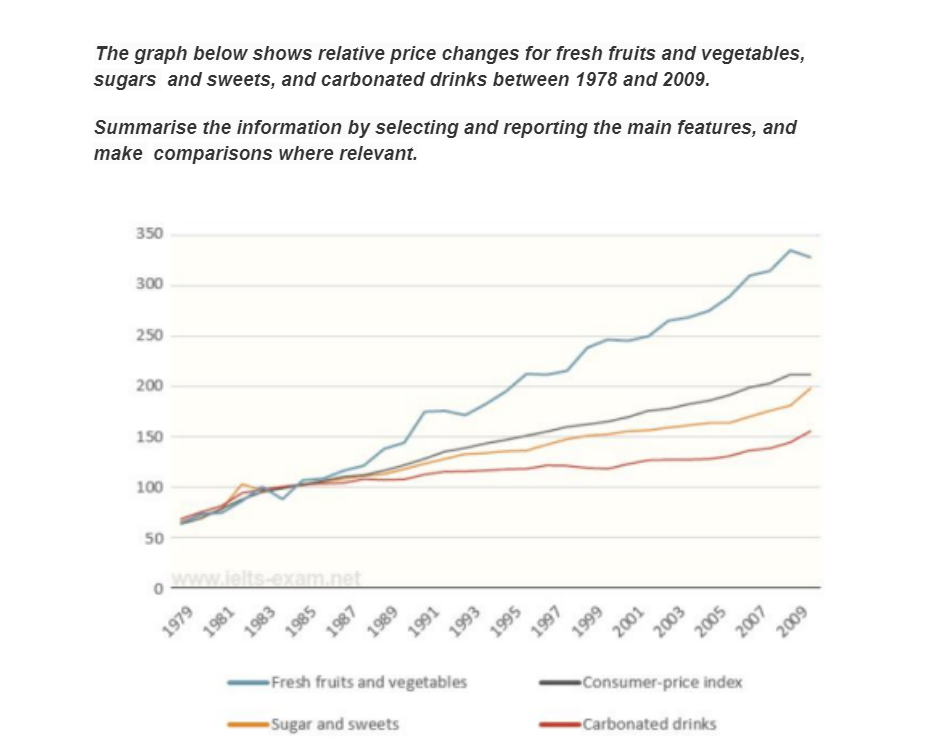
Overall, it is apparent from the information supplied that there was an upward trend among the variation of three products’ prices and the figure for consumer-price index. Additionally, the increase in veggies’ price changing witnessed a fluctuation.
Clearly, the figures for consumer-price index and changes in sugar and sweets’ price tended to be fairly similar, both starting at 50% in 1979. The following years, these two figures witnessed a slow and steady rise, then reached somewhere in the vicinity of 200% in 2009.
In stark contrast, after seeing a moderate growth of 50% from 1979 to 1983, the figure for veggies’ price changing declined marginally in 1984. Meanwhile, changes in the price of sugary drinks remained unchanged at over 100% within 10 years from 1991 to 2001. However, it soon reached 150% in 2009. Regardless of the decrease in 1984, it is noteworthy that the variation of veggie’s price grew exponentially in 1985 and reached a peak at approximately 350% in 2009.
Top answer
Trang Nguyen 8417 A glance at the graph This is an essay for a university lecturer. Professors do not want you to glance at the material, but study it carefully so you can describe it precisely and accurately. Do not use "glance" in Task 1, please.
- Trang Nguyen 8417 A glance at the graph This is an essay for a university lecturer.
- Professors do not want you to glance at the material, but study it carefully so you can describe it precisely and accurately.
- Do not use "glance" in Task 1, please.
- Trang Nguyen 8417 The graph also illustrates the general trend of consumer-price index.
- That is not good.
Get the Weekly English Kit 📬
New words, one handy idiom, and a 2-minute quiz — delivered to your inbox to keep your streak alive.
Trang Nguyen 8417A glance at the graph
This is an essay for a university lecturer. Professors do not want you to glance at the material, but study it carefully so you can describe it precisely and accurately.
Do not use "glance" in Task 1, please.
Trang Nguyen 8417The graph also illus
A glance at the graph provided reveals some striking similarities between changes in the price of three different commodities from 1978 to 2009. The line graph compares the prices of three categories of food (fruits and vegetables; sugars and sweets; and carbonated beverages) with the consumer price index be
Here is a detailed explanation of this graph. It has been posted before by other students.
Note that all the lines cross in January 1983 at a value of 100. This is where the data for each commodity as well as the CPI is normalized. A "basket of goods" in each particular category is give a set index value of 100. For example, the "fruits and vegetables" category might include 1 kilo each
 Related Questions