
IELTS WRITING TASK 1
The graph below shows the number of enquiries received by the Tourist Information Office in one city over a six-month period in 2011.
The line graph gives information about how many enquiries received by Tourist Information Office in a city for six months in 2011.
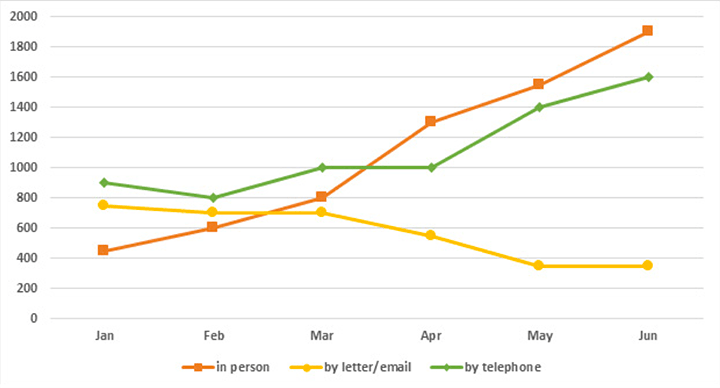
Overall, the number of enquiries received by in person and telephone rose significantly, while a substantial decrease of enquiries was recorded via letter and email.
At the beginning of the period, the number of enquiries recieved by letter and email was about 800. After that, this figure declined twofold in May and then remained stable until June.
By contrast, there was a dramatic rise from about 400 to 800 between January and March in the quantity of enquiries made in person. Then, it became the most popular of common method of enquiry between March and June, and then it reached a peak of 1800 in June. While the telephone enquiries saw a slight decrease from 900 to 800 between January and February, before going up back to 1000 and being stable until April. After that, it saw a sharp rise and peaked at the highest point at 1600 in June.
Top answer
The line graph gives information about how many enquiries [ 1] were received by the Tourist Information Office in a city for over the first six months in of 2011. Overall, the number of enquiries received by i n person and by telephone rose significantly, while a substantial decrease of enquiries was recorded in the questions sent via letter and or email. At the beginning of the period, the number of enquiries rece i ved by letter and or email was about 800.
- The line graph gives information about how many enquiries [ 1] were received by the Tourist Information Office in a city for over the first six months in of 2011.
- Overall, the number of enquiries received by i n person and by telephone rose significantly, while a substantial decrease of enquiries was recorded in the questions sent via letter and or email.
- At the beginning of the period, the number of enquiries rece i ved by letter and or email was about 800.
- After that, this figure the graph declined twofold in to reach half that level by May and then remained stable until flat in June.
- By contrast, there was a dramatic rise from about 400 to 800 between January and March in the quantity number of enquiries made in person.
Get the Weekly English Kit 📬
New words, one handy idiom, and a 2-minute quiz — delivered to your inbox to keep your streak alive.
The line graph gives information about how many enquiries [ 1] were received by the Tourist Information Office in a city for over the first six months in of 2011.
Overall, the numbe
 Related Questions