
IELTS WRITING TASK 1
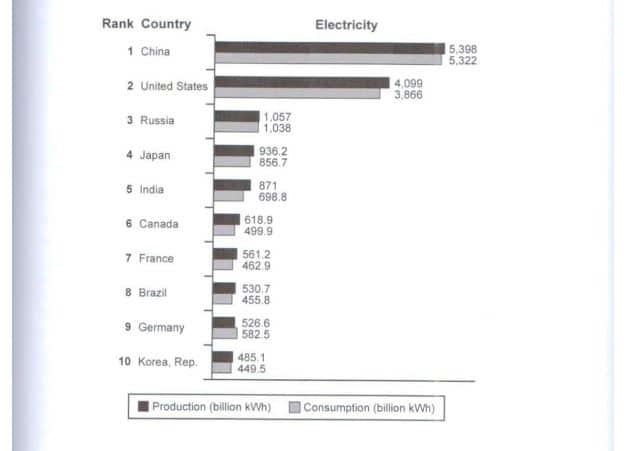
The bar chart below shows the top ten countries for the production and consumption of electricity in 2014.
Summarise the information by selecting and reporting the main features and make comparison where relevant.
The horizontal bar chart compares the amount of electronic produced and expended in ten different countries in the period of 2014.
Overall, China had the largest consumption and production in the volume of electricity. The simmilarity among ten regions was that electronic production recorded higher figure than consumption, except Germany.
Out of ten nations, China, which ranked first in producing and consuming electricity being just over 5,300 billion kWh. Following it, United States was the second highest country with electronic production and consumption, over 4,099 billion kWh and 3,866 billion kWh respectively. Russia is the only nation generating and expending around 1,000 billion kWh, while Japan and India had slight lower numbers ranging from 698 billion to 936 billlion kWh. The chart shows vary numbers in production and consumption of remaining countries, being between 449 billion kWh and 620 billion kWh. Unlike other countries, Germany had larger number in consumption than its production (around 455 billion kWh and 530 billion kWh respectively).
Top answer
The horizontal bar chart compares the amount of electronic (Electronic is an adjective. You cannot use it as a noun. g.
- The horizontal bar chart compares the amount of electronic (Electronic is an adjective.
- You cannot use it as a noun.
- g.
- Mario plays an electronic organ.
- ) produced and expended (wrong word) in ten different countries in the period of 2014.
Get the Weekly English Kit 📬
New words, one handy idiom, and a 2-minute quiz — delivered to your inbox to keep your streak alive.
The horizontal bar chart compares the amount of electronic (Electronic is an adjective. You cannot use it as a noun. e.g. Mario plays an electronic organ. ) produced and expended (wrong word) in ten different countries in the period of 2014. (A period has a begin date and a
 Related Questions