
IELTS Writing Task 1
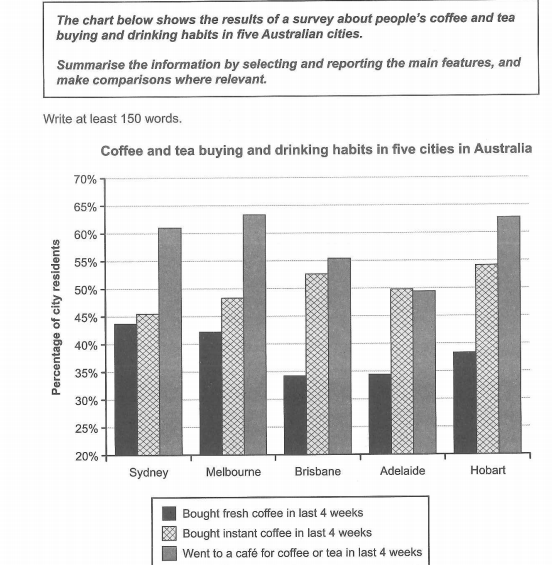
The bar chart shows what the share of people purchasing and drinking tea or coffee is in five different Australian cities following a questionnaire. The first two bars provide information regarding coffee purchase in the last month, namely whether Australians buy fresh or instant coffee. The third bar, instead, gives a representation of the percentage of people who went to a cafeteria for a tea or a coffee over the last four weeks.
According to the bar chart is possible to observe that, in general, the percentage of people going to a café is usually greater than the ones of people buying fresh or instant coffee. However, the exception is represented by the city of Adelaide, where the number of people purchasing instant coffee is higher than the ones going to a cafeteria in the last month.
Besides, it is interesting to observe that in the five Australian cities, the purchase of instant coffee is greater than the one of fresh coffee with a major difference in Brisbane where between the two categories there are about 18 percentage points.
179 words
thank you in advance!
Get the Weekly English Kit 📬
New words, one handy idiom, and a 2-minute quiz — delivered to your inbox to keep your streak alive.
 Related Questions