
IELTS WRITING TASK 1
The bar chart below shows the percentage of Australian men and women in different age groups who did regularly physical activity in 2010.
Summarise the information by selecting and reporting the main features, and make comparisons where relevant.
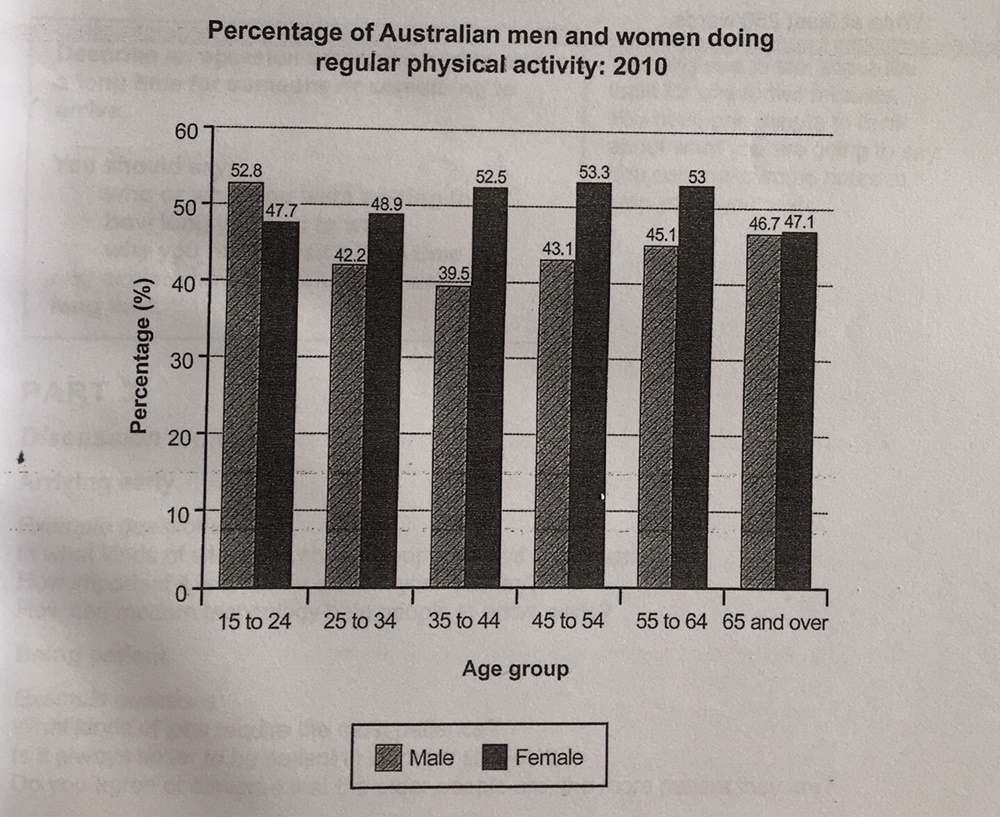
The bar chart illustrates the proportion of Australian’s two genders in a variety of age groups who usually did physical exercise in 2010.
Overall, except for the 15 to 24 age group, women in all age groups did more physical activity than men did. Men in the age group 15 to 24 did more physical activity than any other age groups while in the age of 45 to 54 that women did most.
In the 15 to 24 group, more men than women did frequent physical exercise, with over a half of men but just nearly a half of women did. Regarding the 65 and over group, the difference between the percentage of men and women who did regular physical activity was quite negligible, with 46-47% in both genders.
In contrast, for people from 25 to 64, more women than men did regular physical exercise. Especially in the 35 to 44 age group, there were 52.5% of women did exercise while the number was only 39.5% for men, 13% less than women.
Get the Weekly English Kit 📬
New words, one handy idiom, and a 2-minute quiz — delivered to your inbox to keep your streak alive.
 Related Questions