
IELTS WRITING TASK 1
The charts below give information on the ages of the population of Yemen and Italy in 2000 and projections for 2050.
Summarise the information by selecting and reporting the main features, and make comparisons where relevant.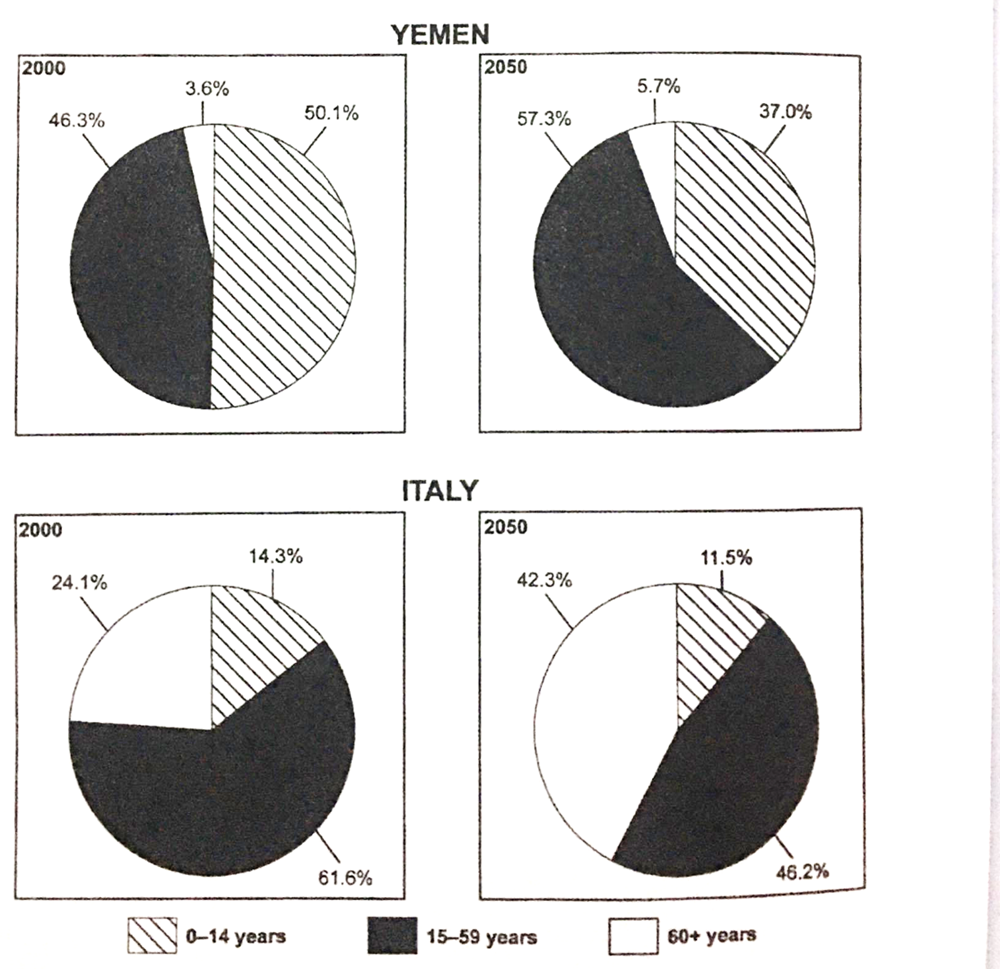
The four pie charts demonstrate the population ages of Yemen and Italy in 2000 and forecast for 2050.
Overall, in both Yemen and Italy, the trends of change in Yemen and Italy are different.
In 2000, the largest part of the charts came to the 0-14 years in Yemen (a half) and 15-59 years in Italy (nearly two-thirds). The 0-14 years in Italy only comprised 14.3%, about one-third of Yemen’s. In both countries, the smallest part came to the elderly (60+ years), with a small fraction of 3.6% in Yemen and about one-fourth in Italy.
In the year 2050, the majority of the population in both countries are expected to be people of working age, which make up 57.3% and 46.2% in Yemen and Italy respectively. In Yemen, the proportion of children (0-14 years) will be 13% less than in 2000, while the percentage of the 60+ years will increase to 5.7%. Regarding Italy, it is predicted that there will be a small decrease in the proportion of 0-14 years but the share of 60+ years nearly double to 42.3%.
Top answer
The four pie charts demonstrate (Not a natural word choice) the population ages (Not a natural phrase) of Yemen and Italy in 2000 and forecast for 2050. If I read your sentence and do not look at the graphic, I have absolutely no idea what it looks like. You did not mention "percentages".
- The four pie charts demonstrate (Not a natural word choice) the population ages (Not a natural phrase) of Yemen and Italy in 2000 and forecast for 2050.
- If I read your sentence and do not look at the graphic, I have absolutely no idea what it looks like.
- You did not mention "percentages".
- You did not mention that one set of two pie charts was for Yemen and the other for Italy.
- You did not mention the age ranges.
Get the Weekly English Kit 📬
New words, one handy idiom, and a 2-minute quiz — delivered to your inbox to keep your streak alive.
The four pie charts demonstrate (Not a natural word choice) the population ages (Not a natural phrase) of Yemen and Italy in 2000 and forecast for 2050.
If I read your sentence and do not look at the graphic, I have absolutely no idea what it looks like. You did not mention
 Related Questions