
IELTS WRITING TASK 1
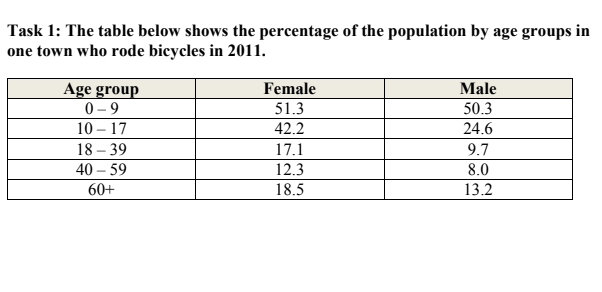
The table compares the proportion of the population of one town who cycled in 2011 according to 5 age groups.
As it can be inferred from the data, in all age groups, the percentage of female cyclists was higher than that of male cyclists. Meanwhile, the lowest proportion of people riding bikes was recorded in the figure for the age of 40 to 59.
Both females and males in the 0-9 age group rode bikes and this proportion remained high in the figure for 10-17 years old females at about 42% while that of males declined by over half to less than 25%.
The figures for the 18-39 and 40-59 years old were much lower. In the former group, only about 17% of women cycled, compared with just under 10% of men. Among the 40-59 years old group, the figures dropped to only 12% for women and 8% for men. However, the proportion of those grew dramatically in the age of over 60 reaching 18,5% for women compared with in the excess of 13% for men.
Top answer
) in each of five age groups. The groups are young children, aged 0-9, older children, aged 10-17, adults aged 18-39, older adults, aged 40-59, and seniors over 60. As it can be inferred from the data, (You are not supposed to draw conclusions or inferences, Just describe the information.
- ) in each of five age groups.
- The groups are young children, aged 0-9, older children, aged 10-17, adults aged 18-39, older adults, aged 40-59, and seniors over 60.
- As it can be inferred from the data, (You are not supposed to draw conclusions or inferences, Just describe the information.
- ) In all age groups, the percentage of female cyclists was higher than that of male s cyclists .
- Meanwhile, the lowest proportion of people riding bikes was recorded in the figure (wrong word) for the age of 40 to 59.
Get the Weekly English Kit 📬
New words, one handy idiom, and a 2-minute quiz — delivered to your inbox to keep your streak alive.
The table compares the proportion of the population of one town who cycled in 2011 according to (wrong phrase) 5 (Write small numbers in words if they are not data values.) in each of five age groups.
 Related Questions