
Ielts writing task 1
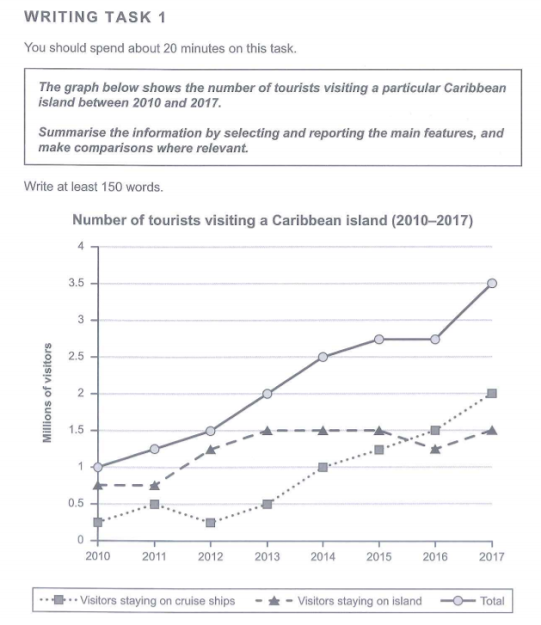
The graph illustrates the number of visitors who went to Caribbean island in the years between 2010 and 2017.
Starkly, while the amount of people staying on the island remain nearly steady in those years, the amount of those went by cruise ships and number in total rocketed through time significantly.
In 2010, there were 750.000 and 250.000 visitors came to the island by cruise ships or decided to stay on the island respectively. In between 2010 and 2012, the features of people staying on ships had met a dramatically decrease to its initial number after a slightly rise in 2011. Nonetheless, it was quite opposite when looking at number of whom staying on the island as it remained static in the first year and then followed by a remarkable increase from 2011 to 2013. Despite increasing, the number of people resided on the island tended to level off in the next three years and then met a trough between 2015 and 2017. On the other hand, the statistic of those staying on a yacht substantially rocketed all the way through 5 years, ended up at its peak at 2 million in 2017.
In conclusion, in spite of the fluctuation of those two number, the total figure had always been remaining gradually rise through all years.
Top answer
) graph illustrates (wrong verb) the number of visitors who went to this / a / one Caribbean island in the years between 2010 and 2017. (Incomplete. You did not tell the reader that there are four curves on this graph.
- ) graph illustrates (wrong verb) the number of visitors who went to this / a / one Caribbean island in the years between 2010 and 2017.
- (Incomplete.
- You did not tell the reader that there are four curves on this graph.
- ) Your vocabulary for task 1 needs improvement.
- Also, you do not write relative clauses correctly.
Get the Weekly English Kit 📬
New words, one handy idiom, and a 2-minute quiz — delivered to your inbox to keep your streak alive.
The (what kind of graph?) graph illustrates (wrong verb) the number of visitors who went to this / a / one Caribbean island in the years between 2010 and 2017. (Incomplete. You did not tell the reader that there are four curves on this graph. That is a very key point.)
Yo
 Related Questions