
Ielts writing task 1
The line graph compares the consumption of junk food in the United States in the period of time from 1970 to 1990.
Overall, it is clear that the rate of people eating pizza tended to fell over the period shown. Fish and chips and hamburger, on the other hand had escalated from 1980 to 1990.
From 1975 to 1980, while the consumption of pizza declined considerably from 300 grams to over 200 grams, the rates of consumers choosing fish and chips rose moderately to over 180 grams. At the same time, the hamburger consumption went up slowly to around 100 grams.
After 1980, there was a dramatic increase in the use of fish and chips. The most enormous growth was from 1985 to 1990, when it rose by 200 grams. In fact, fish and chips consumption was much higher than pizza as the pizza consumption plunged rapidly from 300 grams to 200 grams in 1990. While only 200 grams of pizza were used in 1990, there was about 300 grams of hamburger were used. In fact, hamburger consumption was higher than pizza after the increased from 1985 to 1990.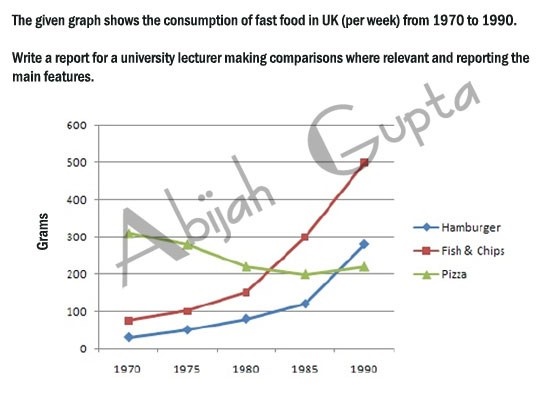
Top answer
) in the period of time from 1970 to 1990. (Incomplete. Is it all junk food, or only certain types?
- ) in the period of time from 1970 to 1990.
- (Incomplete.
- Is it all junk food, or only certain types?
- ) Please read my advice for Task 1 essays.
- It covers most of the errors that learners make in Task 1.
Get the Weekly English Kit 📬
New words, one handy idiom, and a 2-minute quiz — delivered to your inbox to keep your streak alive.
The line graph compares the consumption of junk food in the United States (Look at the figure again.) in the period of time from 1970 to 1990. (Incomplete. Is it all junk food, or only certain types? What are the units of measurement?)
Please read my advice for Task 1 essays. It covers most of the errors that learn
 Related Questions