
IELTS WRITING TASK 1
The chart below shows the Japan's population by age groups starting in 1960 and including a forecast to 2040.
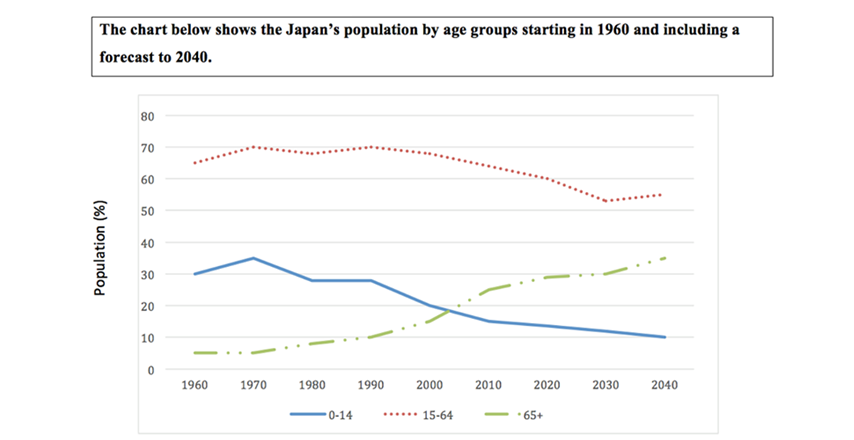
The line graph indicates the population of Japan by different age groups from 1960 to 2040.
Overall, Japan's population by the 15-64 age group is the highest during the period shown. The population of the group over 65 gradually increase, while the proportion of those who are 0-14 years old is significant decrease.
In 1960, the percentage of people who are 15-64 years old was about 65%. 30% was the figure for the 0-14 age group, whereas, over 65 age people accounted for just 5%. By the year 2000, people of the group 15-65 years old still at the top for 69%. In the same time saw the group over 65 age overtook the 0-14 age group as become the second-highest population group in Japan.
By 2040, the proportion of people of the group 15-64 years old is predicted to slightly decline at around 55%. Over 65 age group's population is expected to reach a peak of around 35%, while, there is a constant fall in the percentage of the 0-14 age group at about 10%.
Top answer
) age groups from 1960 to 2040. (Incomplete. ) Model: The line graph gives the population of Japan divided into three age groups, beginning in 1960 to the present, with a projection to 2040.
- ) age groups from 1960 to 2040.
- (Incomplete.
- ) Model: The line graph gives the population of Japan divided into three age groups, beginning in 1960 to the present, with a projection to 2040.
- The age groups are the youth, (age 0 to 14), adults (age 15 to 64), and seniors (over 65).
- Note that I name these groups so to avoid repetition and complex expressions in the body paragraphs.
Get the Weekly English Kit 📬
New words, one handy idiom, and a 2-minute quiz — delivered to your inbox to keep your streak alive.
The line graph indicates plots the population of Japan by different (How many?) age groups from 1960 to 2040. (Incomplete. What are the age groups?)
Model:
The line graph gives the population of Japan divided into three age groups, beginning in 1960 to
 Related Questions