
Ielts writing task 1
the line graph below shows change in the amount and type of fast food consumed by Australian teenagers from 1975 to 2000.
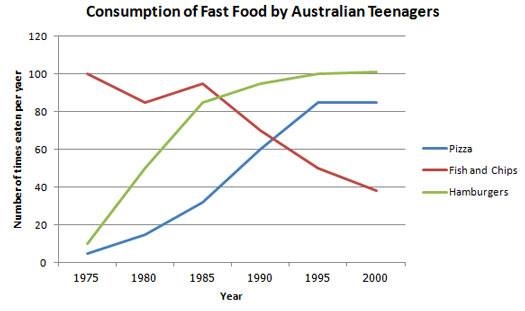
the given chart gives information about the fastfood comsumption rates in three different categories which consumed by young people in Australia between 1975 and 2000.
It can be concluded from the graph that there was a general upward trend in the consumption of both pizza and hamburger, while fish and chips consumption declined throughout the period of 25 years.
in 1975, fish and chips was the most popular fastfood in Australia, with exactly 100 times eaten each year. this statistic for hamburger or pizza was very minimal, just around 5 and 10 times respectively. Over the next 10 years, hamburger saw a dramatic rise in the number of times consumed per year and reached at more than 80 times in 1985. The amount of pizza consumed also grew gradually in the same period before standing at over 30 times eaten at the same period, whereas the figures for fish and chips vary unremarkable.
in the final 15 years, humberger consumption continued rising, but not significantly and remained unchanged at approximately 100 times eaten in 2000, about 20 times more than pizza. By contrast, there was a sharp decrease in the level of fish and chips, a decline to just under 40 times in the last year of the period.
Get the Weekly English Kit 📬
New words, one handy idiom, and a 2-minute quiz — delivered to your inbox to keep your streak alive.
 Related Questions