
IELTS WRITING TASK 1
Please check my essay below. If you are not busy, please check my two another essays. Two days ago I posted these but no one checked for me. cry Here are the links:
1) https://www.englishforums.com/English/IeltsWritingTask1/bxxqql/post.htm
2) https://www.englishforums.com/English/AnotherWritingTask1Essay/bxprxr/post.htm
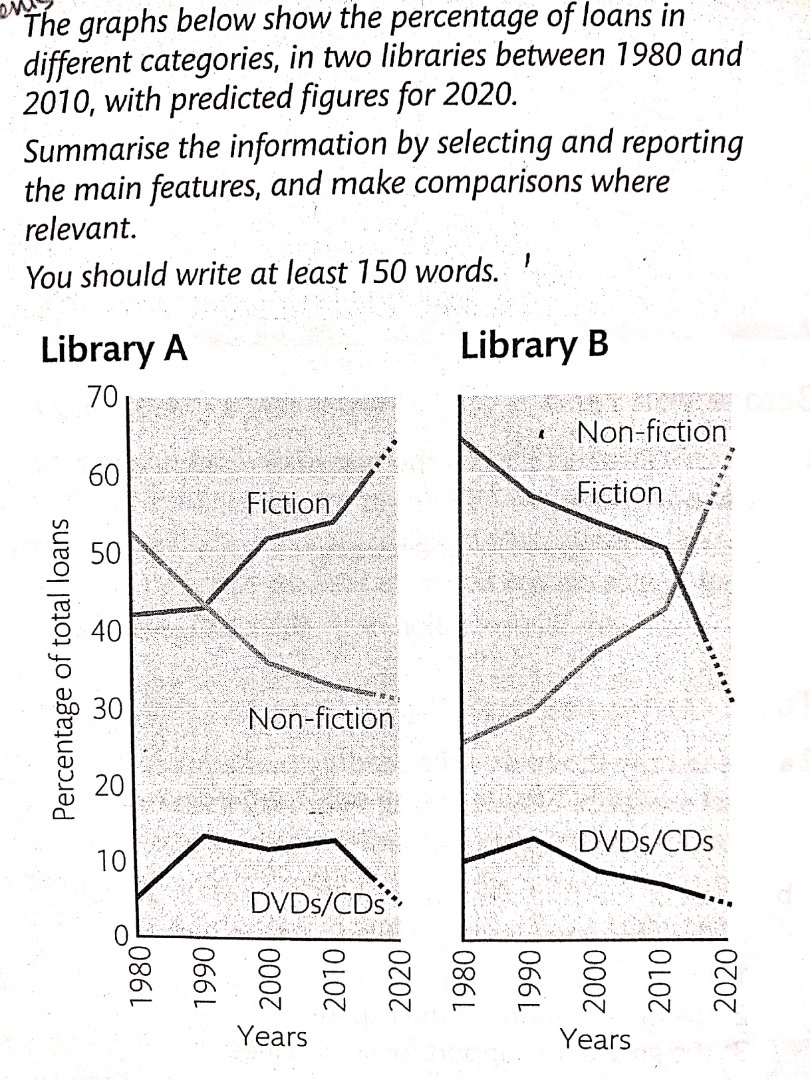
The line graphs gives the figures for loans in different categories, in two libraries in the period from 1980 to 2010, with prediction for 2020. There are a clear differences in borrowing habits between the two locations.
In Library A, the percentage of loans in DVDs/CDs is the lowest over the period. In addition, the number of people borrowing DVDs/CDs is predicted to be continued going down in 2020, with under 10%. In 1980, non-fiction was the most popular category for student to lend, while after ten years, it dropped dramatically and was as high as fiction category. Between 1990 and 2010, the borrowing habits had changed and fiction became more popular than non-fiction. It is predicted that figures for fiction will still climb up until 2020.
In Library B, there are some differences compared to the Library B. In the Library A, the number of borrowing fiction has much more risen up since 1990, while in the Library B the figures for this category has declined from 65% in 1980 to 50% in 2010, including the prediction for 2020. However, there was an increase of approximately 20% in non-fiction loans and even more marked rise is forecast for 2020.
Overall, DVDs and CDs in both libraries had a similar pattern of growth but where as in Library A these held steady for 20 years, in B they declined. In Library A, people prefer fiction and Library B, people choose non-fiction to lend more through the years./data/user/0/com.samsung.android.app.notes/files/clipdata/clipdata_200326_131439_906.sdoc->
Top answer
The line graphs gives outline the figures for changes in loans (fiction, non-fiction and multimedia) in different categories, in two libraries in over the period from 1980 to 2010, with prediction for 2020. There are a clear differences in borrowing habits between the two locations. [ Avoid that kind of waffle.
- The line graphs gives outline the figures for changes in loans (fiction, non-fiction and multimedia) in different categories, in two libraries in over the period from 1980 to 2010, with prediction for 2020.
- There are a clear differences in borrowing habits between the two locations.
- [ Avoid that kind of waffle.
- Of course there are going to be differences!
- ] Overall, while there is an increase in Library A in fiction loans and a decrease in non-fiction ones, the opposite i s true for Library B.
Get the Weekly English Kit 📬
New words, one handy idiom, and a 2-minute quiz — delivered to your inbox to keep your streak alive.
The line graphs gives outline the figures for changes in loans (fiction, non-fiction and multimedia) in different categories, in two libraries in over the period from 1980 to 2010,
 Related Questions