
IELTS Writing task 1.
I really need someone who may correct my essay. Thank you in advance.
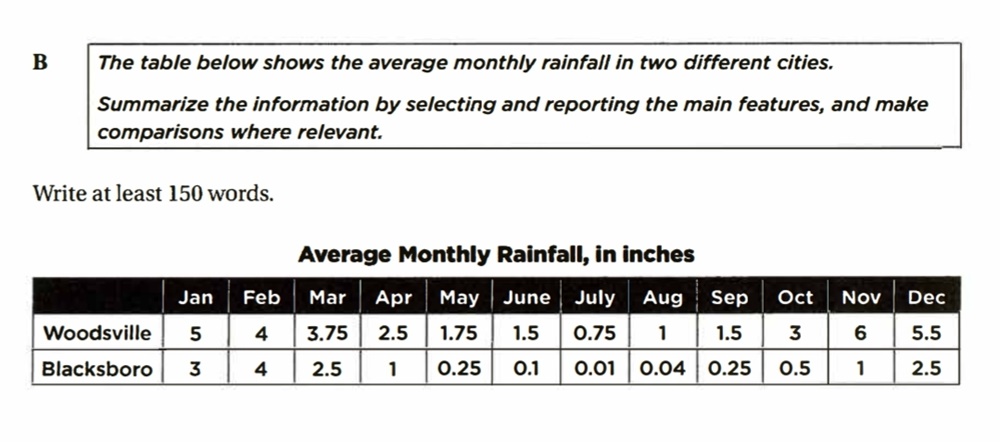
The diagram shows how much Woodsville and Blacksboro are in the rainfall on average each month in different cities. For each month, Woodsville rained more than Blacksboro.
Woodsville's average rainfall according to every months during a year. The number of rainfall in the summer was smaller than in the winter. In fact, from May to September, the figures representing rainfall in this city was not even reached 2 inches. Nevertheless, it appeared that the major was focus in last two months, with 6 inches and 5.5 inches respectively.
Blacksboro's average also varied by months, but in each month number of rainfall lower than Woodsville's one. Almost two-third of all monthly rainfall were under 1 inche. Moreover, July occupied the least rainfall in the chart for this city. On the other hand, Febuary was the month which had the most rainfall of the year, with exactly 4 inches. In addition, 3 inches is accounted for January which was the second largrest number of rainfall in Blacksboro.
In conclusion, in both cities, winter has a major number of the monthly rainfall (from November to Febuary). While in Woodsville, August was the month had lowest figure, Blacksboro had July was the month with least rainfall. /data/user/0/com.samsung.android.app.notes/files/clipdata/clipdata_200321_131432_994.sdoc->
Top answer
The diagram shows how much rainfall the towns of Woodsville and Blacksboro are in the rainfall get on average each mont h. in different cities. For almost each month, Woodsville rained is wetter more than Blacksboro, and the driest month in both cities is July .
- The diagram shows how much rainfall the towns of Woodsville and Blacksboro are in the rainfall get on average each mont h.
- in different cities.
- For almost each month, Woodsville rained is wetter more than Blacksboro, and the driest month in both cities is July .
- Woodsville's average rainfall according to every months is different during the year , but the months in the middle of the year see the least rain .
- The number amount of rainfall in the summer was is smaller than in the winter.
Get the Weekly English Kit 📬
New words, one handy idiom, and a 2-minute quiz — delivered to your inbox to keep your streak alive.
The diagram shows how much rainfall the towns of Woodsville and Blacksboro are in the rainfall get on average each month. in different cities. For almost each month, Woodsville rained
 Related Questions