
Ielts writing task 1
I have wrote a new writing task 1. Please my writing. Thank you very much.
Topic: The graph below gives the information about the popular activities that Australian children took part in 2012.
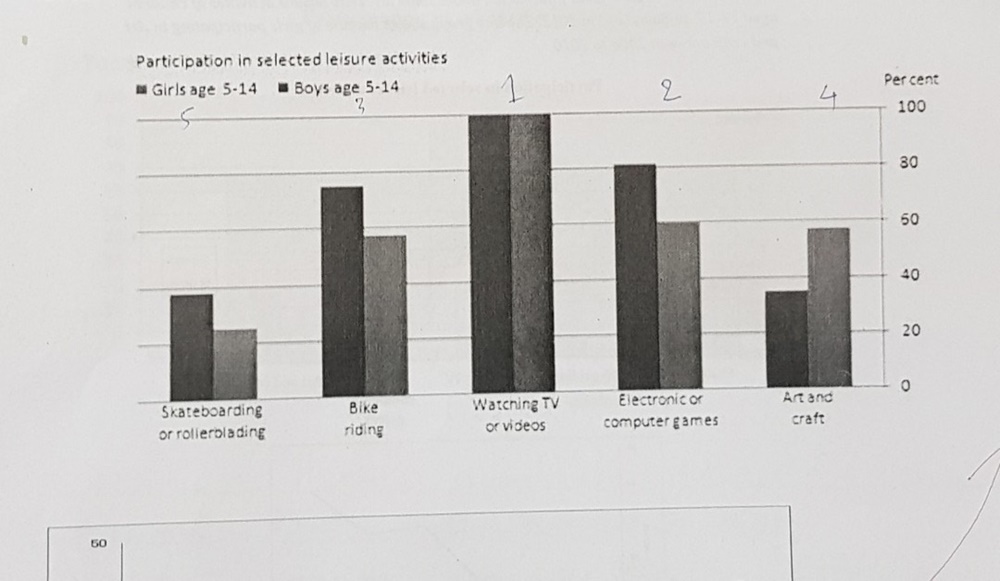
The given bar chart illustrates detailed information about the several common leisure activities that children aged 5 to 14 joined in Australia in 2012.
Overall, it is clear that there were a significant differences in the interests of boys and girls, except watching TV or videos.
In detail, the most striking feature is that watching television and videos was the most popular activities with 100 percent of both boys and girls participating. Around 80% of boys took part in playing computer or electronic games, while three-fifths of girls spent their free time on this activities. The figures for riding bike tend to be similar with the former, a very large majority in boys participate compared to nearly 60% of girls.
In contrast to, the proportion of boys and girls joining in art and craft was more than that of boys with under 60% in comparison to nearly 40%. Finally, skateboarding or rollerblading were the least common attitudes with children surveyed.
Top answer
Please make a separate post for a new essay. ) gives / compares / plots detailed information about That is not specific enough. ) leisure activities that children aged 5 to 14 joined in Australia in 2012.
- Please make a separate post for a new essay.
- ) gives / compares / plots detailed information about That is not specific enough.
- ) leisure activities that children aged 5 to 14 joined in Australia in 2012.
- (You did not tell the reader what was on the chart.
- What is measured?
Get the Weekly English Kit 📬
New words, one handy idiom, and a 2-minute quiz — delivered to your inbox to keep your streak alive.
Please make a separate post for a new essay.
The given (awkward, unnatural) bar chart illustrates (Illustrate means "make a picture." Use it for maps, flow charts, and diagrams, not for charts and graphs.) gives / compares / plots
 Related Questions