
IELTS Writing Task 1
Can you check it for me, please? Thank you
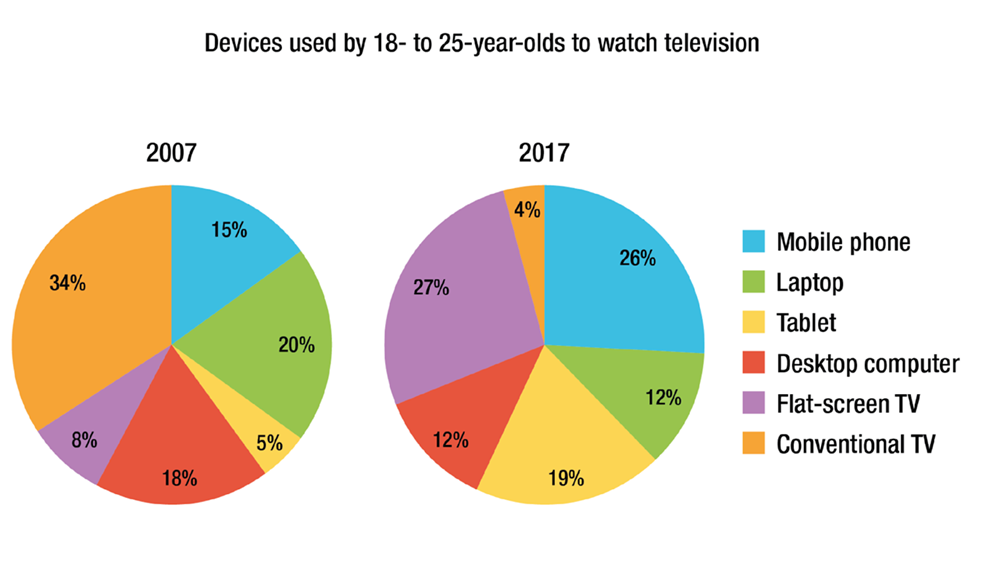
The two pie charts illustrate the percentage of people who use the devices aged 18-25 to watch television in the European country in 2007 and 2017.
Overall, in both years, the most significant devices used by people were conventional TV and Flat-screen, which together accounted for over half, whereas the device increased dramatically for mobile phone and tablet, there were corresponding drops in using the device on things such as laptop and on other desktops computer.
At 18% we can see that desktop computer accounted for the majority of people who used the device in 2007, but this percentage had dropped to 12% by 2017. Likewise, in 2007, using a mobile phone 15% which rose marginally to 26% after 10 years. In contrast, using the device of conventional TV and laptop saw the opposite trend. Conventional TV (34%) and laptop (20%) decreased dramatically to 4% and 12% respectively. Similar to the device of Flat-screen TV (8%) and tablet (5%) in 2007 saw a rising trend, growing from only 27% and 19% in 2017.
Get the Weekly English Kit 📬
New words, one handy idiom, and a 2-minute quiz — delivered to your inbox to keep your streak alive.
 Related Questions