
IELTS Writing Task 1
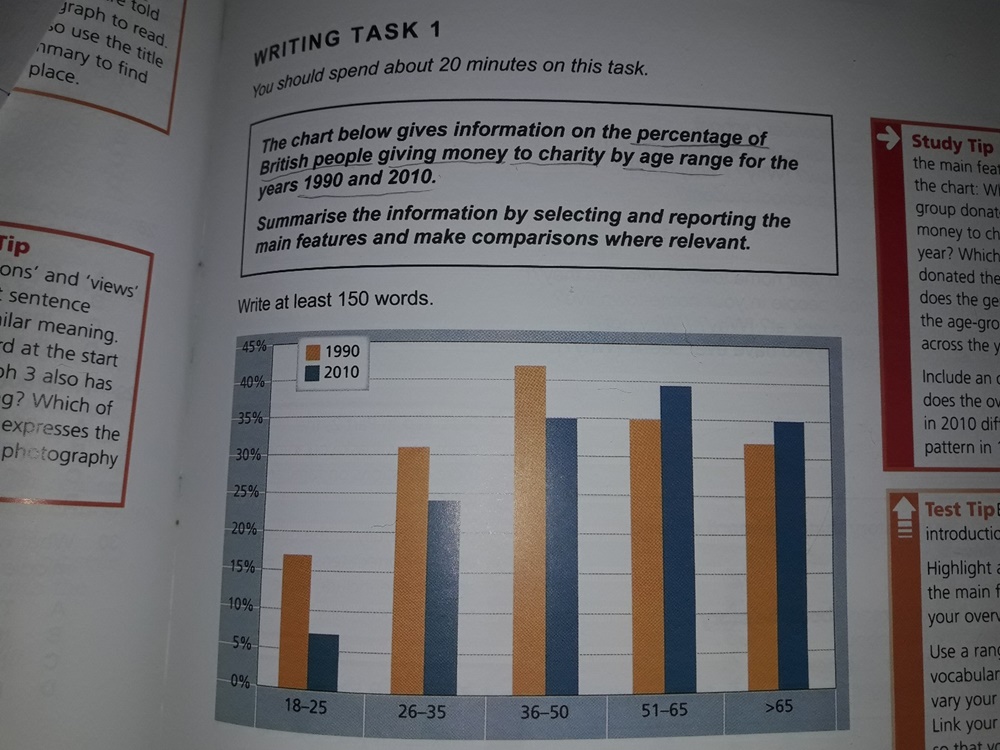
The bar chart compares the number of British people spending money for charity in different age groups ranging from 18 to above 65 in years 1990 and 2010.
Overall, in 1990, the most amount of money was spent by people aging 36 to 50 years old; however, people between 18 and 25 spent the least. British people between 51 and 65 gave the biggest sum of money in the year 2010.
The figures of the people over 65 grew slightly over this 20-year period and reached 35% from the former percentage of 32. The percentage of those between 51 and 65 saw a 5-percent-rise as well and reached approximately 40% in 2010.
People in all three age groups including: 18 to 25, 26 to 35 and 36 to 50 decreased the amount of money dedicating to charity in 2010. The most remarkable decline was in the figures of people between 18 and 25 which decreased to about half of its percentage in 2010 and fell to 7%. The two other age groups'(26-35 and 36-50) figures fell by the same amount of 7% and reduced to 24% and 35 %, respectively.
WRITE DESCRIPTION HERE
Top answer
You need to pay very careful attention to exactly what is shown in the figure that you are given to write about. Much of your writing does not describe this bar chart data. The bar chart compares the number (Wrong word.
- You need to pay very careful attention to exactly what is shown in the figure that you are given to write about.
- Much of your writing does not describe this bar chart data.
- The bar chart compares the number (Wrong word.
- ) age groups ranging from 18 to above 65 in years 1990 and 2010.
- Overall, in 1990, the most amount of money (The bar chart does not show amounts of money at all.
Get the Weekly English Kit 📬
New words, one handy idiom, and a 2-minute quiz — delivered to your inbox to keep your streak alive.
You need to pay very careful attention to exactly what is shown in the figure that you are given to write about. Much of your writing does not describe this bar chart data.
The bar chart compares the number (Wrong word. A number is a set of digits like 45 or 23764 or 428790.) of British people
 Related Questions