
IELTS Writing Task 1
Can you check it for me, please? Thank you very much
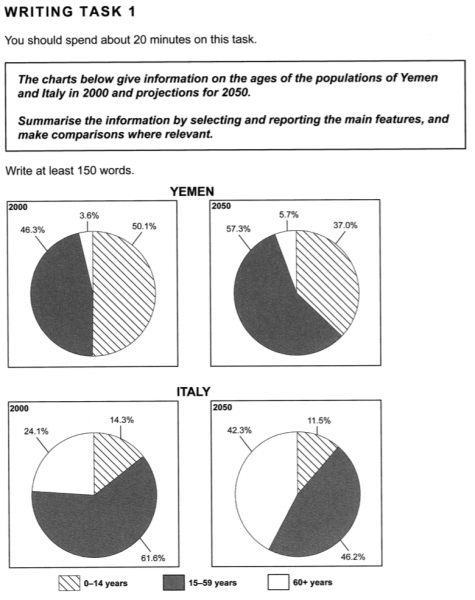
The pie charts providing the percentage of populations in Yemen and Italy according to three age groups between 2000 and 2050.
Overall, the highest proportion of people in Yemen were aged under 14 while most Italians fell into the 15-59 age group in 2000. It is predicted that in 2050, populations of both nations will show an increase in the percentage of elderly people.
In 2000, the proportion of people under 14 years old accounted for 50%, making it the largest percentage of populations owned by an age group, but in 2050 this is forecasted to decline by 13% to a figure of 37%. By contrast, the populations of people from 15 to 59 years old will increase by 2%, with 5.7% in 2050. Likewise, the percentage of people in the age group from 15 to 18 is also predicted to increase to 57,3%, which is slightly higher than the people in this age group in 2000.
In Italy, the number of people aged over 60, from 24,1% in 2000 to 42,3 % in 2050. While the middle age group, 15-59 years which is the largest portion of the population in 2000 at 61.6% will reduce to 46.2% by 2050. However, the percentages of children, 0-14 years are the least in 2000 at 14.3% and will further decrease by 3% in 2050.
Top answer
Dear Teacher, (AlpheccaStars) Can you check it for me, please? Thank you
- Dear Teacher, (AlpheccaStars) Can you check it for me, please?
- Thank you
Get the Weekly English Kit 📬
New words, one handy idiom, and a 2-minute quiz — delivered to your inbox to keep your streak alive.
Dear Teacher, (AlpheccaStars)
Can you check it for me, please? Thank you
The pie charts (How many?) providing (wrong form) the percentage of populations in Yemen and Italy according to three age groups between 2000 and 2050. (This is not very clear.)
Model essay:
The four pie charts, labelled Yemen, 2000 and 2050, and Italy, 2000 and 2050, give the population of the count
 Related Questions