
IELTS Writing Task 1
Can you check for me, please! Thank you very much
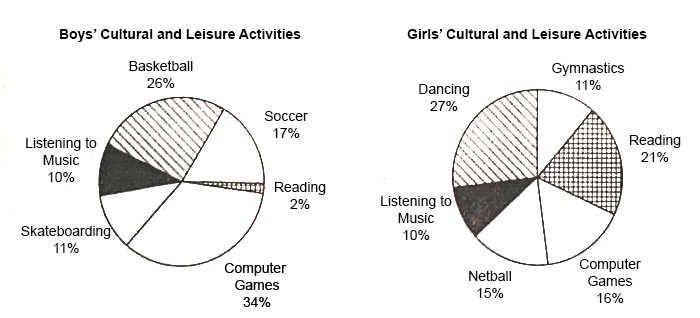
Topic: The pie graphs below show the result of a survey of children's activities. The first graph shows the cultural and leisure activities that boys participate in, whereas the second graph shows the activities in which the girls participate.
The two pie charts draw the conclusion of a survey of boys' and girls' cultural and leisure activities.
Overall, equal quantities of both sexes enjoyed listening to music, but a dramatically larger number of girls liked reading. There were also many differences in terms of children's preferred sports.
Turning to the first chart, we can observe that boys prefer playing computer games (34% participation rate) than taking other activities. Playing basketball comes as the second most popular leisure, practiced by almost a third of male children. Basketball is followed by soccer, which is exercised by 17%. Skateboarding and listening to music are less preferable activities, chosen by 11% and 10% of boys respectively. Reading, the least popular cultural activity among boys represents only two percent.
Taking a closer look at the second chart, we can see that the girls' most preferred activity is dancing, being 27% of the total. In contrast to the boys' preferences, reading is chosen by more than a fifth of all girls. Although the percentage of female children who play computer games is roughly twice less than that of boys (16%), this activity is the third most popular on the girls' chart. With a slight difference between computer games and netball, the latter is practiced at a 15% rate. Similarly to skateboarding popularity among boys, 11% of girls go in for gymnastics. Listening to music comes as the least popular leisure, with a proportion of 10%, equal to those on the first chart.
Top answer
The two pie charts draw the conclusion (incorrect - depict the results ) of a survey of boys' and girls' cultural and leisure activities. Each chart shows six activities. "Draw a conclusion" means to state in words the implications of a test, a research project of a survey.
- The two pie charts draw the conclusion (incorrect - depict the results ) of a survey of boys' and girls' cultural and leisure activities.
- Each chart shows six activities.
- "Draw a conclusion" means to state in words the implications of a test, a research project of a survey.
- g.
- " Overall, equal quantities percentages of both boys and girls sexes enjoyed listening to music, but a dramatically larger number percentage of girls liked reading.
Get the Weekly English Kit 📬
New words, one handy idiom, and a 2-minute quiz — delivered to your inbox to keep your streak alive.
The two pie charts draw the conclusion (incorrect - depict the results ) of a survey of boys' and girls' cultural and leisure activities. Each chart shows six activities.
"Draw a conclusion" means to state in words the implications of a test, a research project of a survey. e.g. "We
 Related Questions