
Ielts Writing Task 1
Please check this essay for me. Thank you in advance
» You should spend about 20 minutes on this task.
The chart below shows the amount of money per week spent on fast foods in Britain. The graph shows the trends in consumption of fast foods.
Write a report for a university lecturer describing the information shown below.
» You should write at least 150 words.
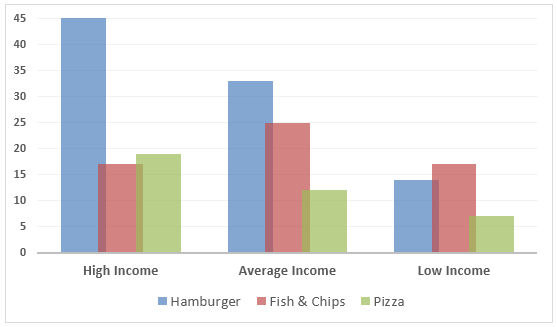
Expenditure (Pence per person) on Fast Food, by Income Groups, UK 1990
Consumption of fast food per person in gram in Britain.
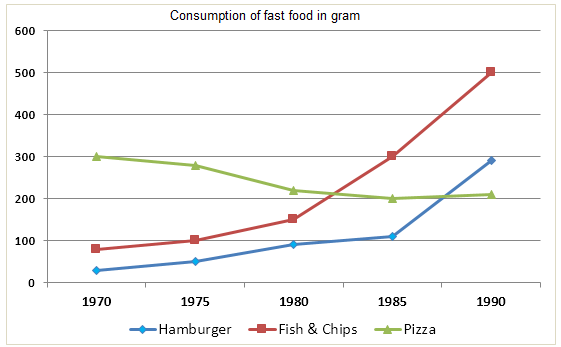
The bar chart illustrates how much money the British citizens spent on three fast food items based on their economic status in 1990, and the line graph reveals the consumption of these items from 1970 to 1990.
In general, expenditure on fast food varied based on people’s income and the pizza was the most consumed item in 70’s but in later years, consumption of fish & chips increased remarkably.
According to the bar graph, high-income class people spent more money on the hamburger (40 Pence/person) than on fish & chips and pizza. Their spending was also higher than average and low-income class people on fast food. Average income class people also spent more on hamburgers but their spending on fish and chips (25 pence) was more than other two income groups. Finally, the low-income class British citizens spent comparatively less on fast food items and fish& chips cost them most (about 17 pence). They spent the least amount on purchasing pizza (around 7 pence/person).
On the other hand, people ate pizza than any other fast food in 1970. UK citizens, in this year, devoured more than 300 grams of pizza while the consumed only 100 grams of hamburger and fish & chips. The percentage of pizza consumption started declining and reached to only 200 grams on 1990. On the contrary, the popularity of the fish and chips reached to 500 grams in 1990. Finally, the consumption of hamburger also increased and reached to around 300 grams in 1990.
Get the Weekly English Kit 📬
New words, one handy idiom, and a 2-minute quiz — delivered to your inbox to keep your streak alive.
 Related Questions