
IELTS Writing Task 1
Can you check for me, please! Thank you very much.
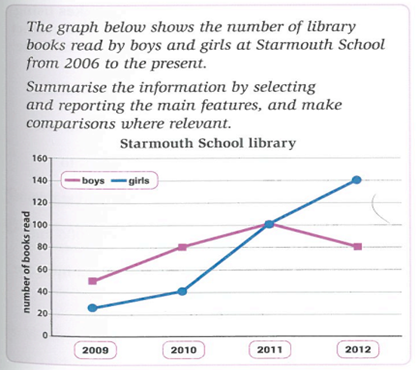
The graph gives information about how many books in the library have read among boys and girls at Starmouth School between 2009 and the present day.
In 2009, boys read 50 books and girls read only 25 books. After that, these number of books rose slightly to 80 and 40 respectively in 2010. At this year the number of books read by the male students was double the number of books read by female students. Between 2010 and 2011, the number of books reads by boys increased gradually to 100, while the number of books read by girls rose sharply to 100. In 2012, the figure for girls risen dramatically to 140, but boys have read fewer books so it dropped gradually to 80.
Overall, it is obvious that there was an upward trend for books which are read by females students. Even though male students read more books in 2009 and 2010, but finally they fell to 80 which is lower than girls in 2012.
Top answer
) graph shows gives information about how many books in the library have read (wrong form) among boys and girls at Starmouth School between 2009 and the present day . (That would be 2018. ) In 2009, boys read 50 books and girls read only 25 books.
- ) graph shows gives information about how many books in the library have read (wrong form) among boys and girls at Starmouth School between 2009 and the present day .
- (That would be 2018.
- ) In 2009, boys read 50 books and girls read only 25 books.
- After that, these number of books rose slightly by 60% (Is 60% "slight"?
- ) to 80 and 40 respectively in 2010.
Get the Weekly English Kit 📬
New words, one handy idiom, and a 2-minute quiz — delivered to your inbox to keep your streak alive.
The (What kind of graph?) graph shows gives information about how many books in the library have read (wrong form) among boys and girls at Starmouth School between 2009 and the present day. (That would be 2018. DOes the graph extend to October, 2018?)
In
 Related Questions