
IELTS Writing TASK 1
Hi, AlpheccaStars
Please help me to check this essay. Thank you very much.
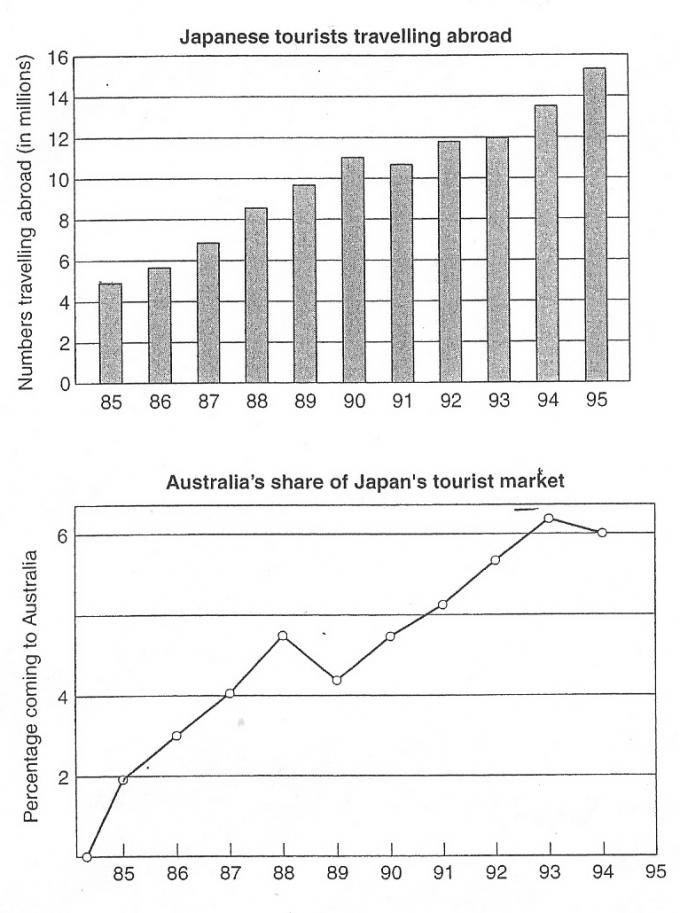
The bar chart gives information about how many Japanese travelers visiting overseas over a ten-year period and the line graph illustrates the percentage of Japanese tourists traveled to Australia between 1985 and 1989.
Overall, what stands out from the graph is that there was an upward trend in the number of Japanese tourists traveling abroad.
In 1985, there were 4 million Japanese traveled in order country and rose to nearly over 11 million after 5 years. Then it slightly declined to a million in 1991, after a year it increased by 2 million in 1992 and remained steady for 2 years, lastly, the Japanese tourist suddenly grew in number and hit the highest point at about million in 1995.
Meanwhile, the proportion of Japanese people traveling to Australia rose considerably from about 2% to 5% between 1985 and 1989. From 1989 up to 1993, It significantly rose again and peaked at a year in 1993 at about 6.2% of Australian's share, it gradually decreased minimally at 6% after 2 years.
Top answer
Sorry, I forgot the topic. Here is the topic, can you check my essay for me, please? Topic: The charts below show the number of Japanese tourists travelling abroad between 1985 and 1995 and Australia's share of the Japanese tourist market.
- Sorry, I forgot the topic.
- Here is the topic, can you check my essay for me, please?
- Topic: The charts below show the number of Japanese tourists travelling abroad between 1985 and 1995 and Australia's share of the Japanese tourist market.
Get the Weekly English Kit 📬
New words, one handy idiom, and a 2-minute quiz — delivered to your inbox to keep your streak alive.
Sorry, I forgot the topic. Here is the topic, can you check my essay for me, please?
Topic: The charts below show the number of Japanese tourists travelling abroad between 1985 and 1995 and Australia's share of the Japanese tourist market.
The bar chart gives information about how many Japanese travelers visiting people travelled overseas over a ten-year period starting in 1985, and the line graph illustrates the percentage of Japanese tourists who traveled to Australia
 Related Questions