
IELTS Writing Task 1
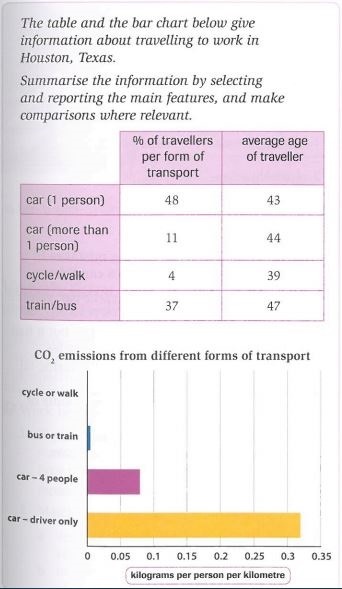
The table and chart illustrate the percentage of commuters using different means of transport for their average age and the amount of carbon dioxide produced by each type of travelers.
The most popular form of transport is the private car accounting for 48 percent, whereas the figure for people who share their cars with other is 11%. On the other hand, 37 percent of commuters use train or buses, while 4 percent of the people use to walk and cycle to their work. According to the first chart, the average age of them is 47. Last on the list is cycling or walking, taking up only 4%. They are also the youngest of all these four types of travelers.
According to the second chart, there are some kinds of transportation which release CO2 emissions into the air. The unit of the parameter is a kilogram of released CO2 per person per kilometer. The most CO2 emissions are from the car which drives by only one person, sightly 0.3 kilos per person kilometer. People who share transport produce 0.8 kilos while using public transport produce only a tiny amount.
Top answer
The English of your essay is not very good. Write shorter correct sentences. It is more important correctly describe the figures than to try to be sophisticated.
- The English of your essay is not very good.
- Write shorter correct sentences.
- It is more important correctly describe the figures than to try to be sophisticated.
- It is better not to use synonyms in Task 1.
- The task is to be precise, and synonyms seldom have exactly the same meaning.
Get the Weekly English Kit 📬
New words, one handy idiom, and a 2-minute quiz — delivered to your inbox to keep your streak alive.
The English of your essay is not very good. Write shorter correct sentences. It is more important correctly describe the figures than to try to be sophisticated. It is better not to use synonyms in Task 1. The task is to be precise, and synonyms seldom have exactly the same meaning.
The table and (what kind of chart?) chart illustrate the percentage of commuters using
 Related Questions