
IELTS WRITING TASK 1
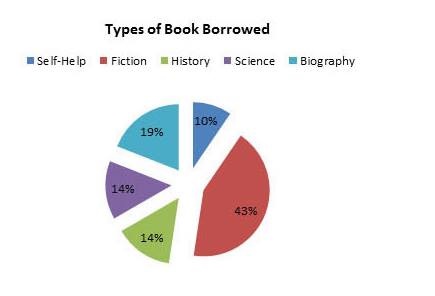
The graph illustrates the number of borrowed books from June to September in 2014 at four different village libraries. The pie chart indicates the proportion of five kinds of book which were borrowed within the mentioned period of time above.
Overall, there was an increase in books from the majority of library except Ryeslip. Fiction was borrowed the most in preference to other types of book.
In June, Ryeslip recorded the highest quantity of borrowed books, standing at 300, but it then declined considerably and ended at approximately 175 in September. Meanwhile, Sutton Wood experienced a significant drop in July and hit the bottom at 100 the following month before becoming the highest borrowed books library in September. In contrast, both West Eaton and Church Mount had the same figure at the start of the period which stood at 50. Then, they shared a similar upward trend and finished at 200 at the end of the period.
It is clear from the given pie chart that fiction took the lion’s share of all types of books throughout the period, which was at 43%. This was followed by biography at 19%, whereas history and science shared the same percentage at 14% and the rest, self-help, represented only 10%.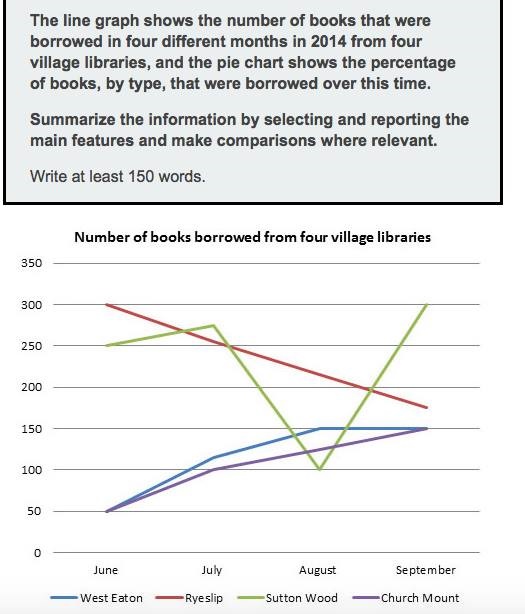
Get the Weekly English Kit 📬
New words, one handy idiom, and a 2-minute quiz — delivered to your inbox to keep your streak alive.
 Related Questions