
IELTS WRITING TASK 1
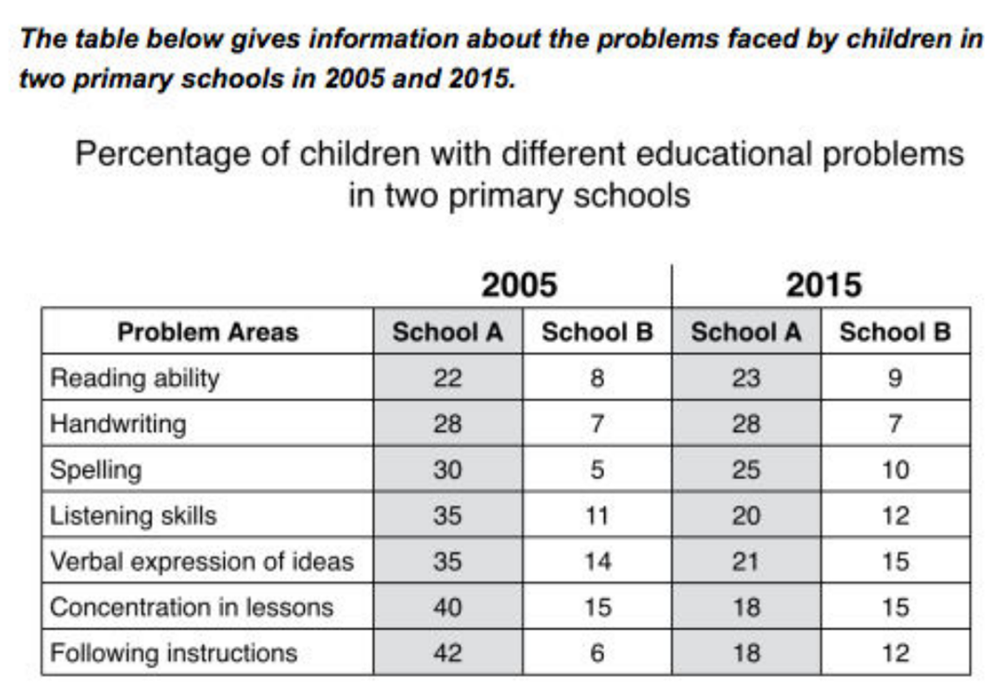
The table compares the proportion of students with seven educational issues in school A and school B in the years 2005 and 2015.
Overall, school A had higher proportions of children struggling with the problems in both years. However, this school managed to reduce the incidence of almost all problems between 2005 and 2015, while school B saw an overall rise in the percentage of struggling children.
In school A, following instructions and concentration were the most important issues, accounting for 42% and 40% of students respectively in 2005, but each fell significantly to just 18% in 2015. The figures for children having problems with reading and handwriting remained almost unchanged, while the percentages of students struggling with other problems declined to below 30% in 2015.
By contrast, in school B, the proportions of children finding it hard to follow instructions and spell doubled in 2015, reaching 10% and 12% respectively. Students who struggled with concentration was the highest, at 15% in both 2005 and 2015, over twice as high as the figures for handwriting and following instructions in 2005. The figures for the other issues rose slightly in 2015.
Top answer
The table compares the proportion of students with seven educational issues (wrong word) in school A and school B in the years 2005 and 2015. Overall, school A had higher proportions of children struggling with the problems in both years. However, this school managed to reduce the incidence of almost all problems between 2005 and 2015, while school B saw an overall rise in the ir percentages of struggling children .
- The table compares the proportion of students with seven educational issues (wrong word) in school A and school B in the years 2005 and 2015.
- Overall, school A had higher proportions of children struggling with the problems in both years.
- However, this school managed to reduce the incidence of almost all problems between 2005 and 2015, while school B saw an overall rise in the ir percentages of struggling children .
- In school A, following instructions and concentration were the most important issues , accounting for 42% and 40% of students respectively in 2005, but each fell significantly to just 18% in 2015.
- The figures for children having problems with reading and handwriting remained almost unchanged, while the percentages of students struggling with other problems declined from ...
Get the Weekly English Kit 📬
New words, one handy idiom, and a 2-minute quiz — delivered to your inbox to keep your streak alive.
The table compares the proportion of students with seven educational issues (wrong word) in school A and school B in the years 2005 and 2015.
Overall, school A had higher proportions of children struggling with the problems in both years. However, this school managed to reduce the incidence of almost all problems between 2005 and 2015
 Related Questions