
IELTS WRITING TASK 1
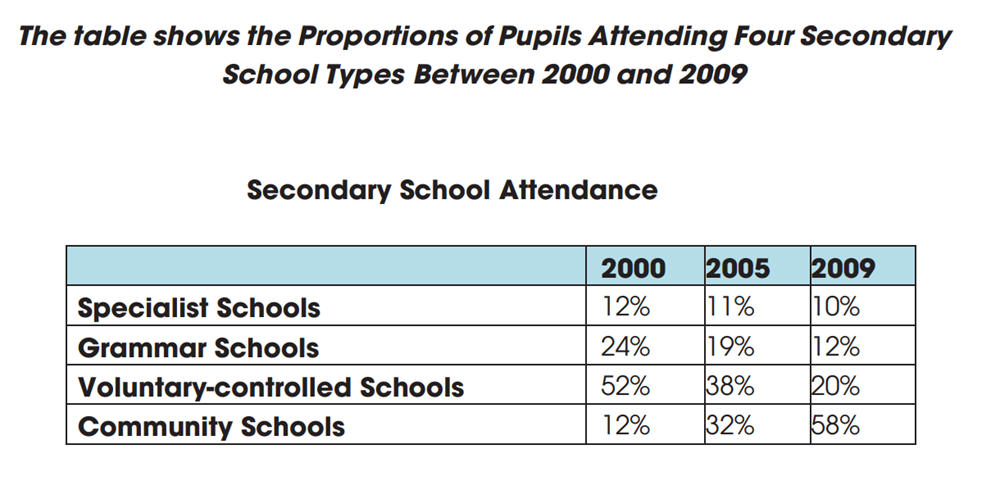
The chart compares the percentages of schoolchildren going to four different secondary school types from 2000 to 2009.
Overall, there was a dramatic increase in the proportion of pupils attending community schools over the 9-year period. By contrast, the figures for specialist schools, grammar schools and voluntary-controlled schools went down by varying degrees.
It is noticeable that the proportion of schoolchildren going to voluntary-controlled schools dropped significantly from just over half in 2000 to only 20% in 2009. Similarly, the figures for grammar schools, at 24%, fell suddenly by half in the same period. There was slight drop in percentage of pupils attending specialist schools, a fall of only 2%.
However, while the other three types of schools experienced decreases in importance, the pattern was reverse in the case of community schools. In 2000, only 12% of students attended community schools, but the figures doubled to 32% in 2005, and then rocketed to 58% in 2009.
Top answer
The chart compares the percentages of schoolchildren going to four different secondary school types from in the years 2000, 2005 and to 2009. Overall, there was a dramatic increase in the proportion of [ 1] pupils those attending community schools over the 9-year period. By contrast, the figures for specialist schools, grammar schools and voluntary-controlled schools went down by varying degrees.
- The chart compares the percentages of schoolchildren going to four different secondary school types from in the years 2000, 2005 and to 2009.
- Overall, there was a dramatic increase in the proportion of [ 1] pupils those attending community schools over the 9-year period.
- By contrast, the figures for specialist schools, grammar schools and voluntary-controlled schools went down by varying degrees.
- It is noticeable that the proportion of schoolchildren going to voluntary-controlled schools dropped significantly from just over half of the total [ 2 ] in 2000 to only 20% in 2009.
- Similarly, the figures for grammar school s started at 24% in 200 3, but fell suddenly by half in the same period.
Get the Weekly English Kit 📬
New words, one handy idiom, and a 2-minute quiz — delivered to your inbox to keep your streak alive.
The chart compares the percentages of schoolchildren going to four different secondary school types from in the years 2000, 2005 and to 2009.
Overall, there was a dramatic increase in the proportion of [ 1] pupils those
 Related Questions