
IELTS Writing task 1
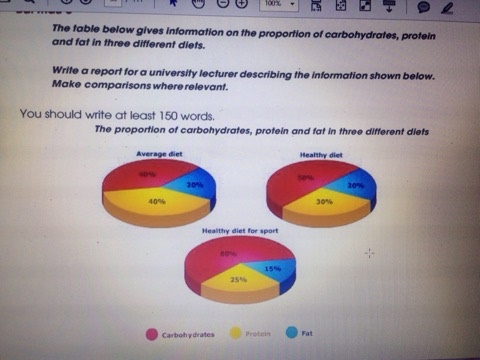
The pie charts compare the percentage of carbohydrates, protein and fat in three different diets, namely an Average diet, Healthy diet and Healthy diet for sport.
It is noticeable that diet of sport-people require the proportion of carbonhydrates higher than an Average diet or Healthy diet. The Average diet contains the lowest percentage of carbonhydrates but the highest proportion of protein.
As we can be seen that 60% of carbonhydrates belongs to Healthy diet for sport higher Healthy diet 10% and 20% more than Average diet. However, The percentage of Protein and Fat in Healthy diet for sport is the lowest in three different diets. On the other hand, people who eat an average diet consume a greater amount of protein (40%) than those who eat a healthy diet (30%) and sport people (25%).
The last compound is fat. An Average diet and Healthy diet occupy 20% of Fat higher 5% than Healthy sports diet.
Top answer
The three pie charts compare the percentage of carbohydrates, protein and fat in three different diets, namely an Average diet, Healthy diet and Healthy diet for sport. It is noticeable that diet of sport-people require the proportion of carbonhydrates to be higher than an Average diet or Healthy diet. The Average diet contains the lowest percentage of carbonhydrates but the and highest proportion of protein.
- The three pie charts compare the percentage of carbohydrates, protein and fat in three different diets, namely an Average diet, Healthy diet and Healthy diet for sport.
- It is noticeable that diet of sport-people require the proportion of carbonhydrates to be higher than an Average diet or Healthy diet.
- The Average diet contains the lowest percentage of carbonhydrates but the and highest proportion of protein.
- As we can be seen that 60% of carbonhydrates belongs to Healthy diet for sport higher Healthy diet 10% and 20% more than Average diet.
- ) However, The percentage s of both Protein and Fat in the Healthy diet for s port is the lowest of the in three different diets.
Get the Weekly English Kit 📬
New words, one handy idiom, and a 2-minute quiz — delivered to your inbox to keep your streak alive.
The three pie charts compare the percentage of carbohydrates, protein and fat in three different diets, namely an Average diet, Healthy diet and Healthy diet for sport.
It is noticeable that diet of sport-people require the proportion of carbonhydrates to be higher than an Average
 Related Questions