
IELTS Writing Task 1
The line graph illustrates the amount of four different types of food which people in a European nation consumed from 1979 to 2004.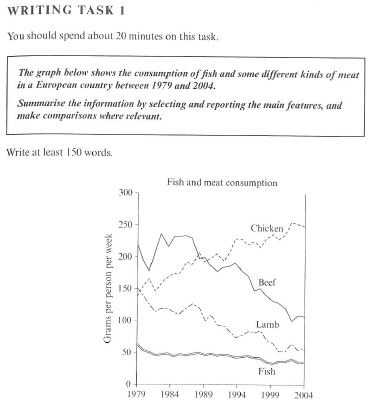
Overall, fish was the least commonly used food in the European country throughout the period shown. Also, the expenditure on beef, lamb and fish decreased, while there was a fluctuating increase in the figure for chicken.
It can be seen from the graph that in 1979, the amount of beef which was consumed was the highest, at about 220 grams per person per week. The figures for chicken and lamb was lower, at under 150 grams and exactly 150 grams respectively. However, fish accounted for the lowest number with only about 60 grams eaten.
In the period between 1979 and 2004, the country witnessed a significant growth to around 250 grams in the consumption of chicken. By contrast, around 50 grams of lamb was eaten, compared to about 40 grams of fish in 2004. Although the consumption of beef reached a peak of about 240 grams in 1983, this fell steadily to just over 100 grams in 2004.
Top answer
Essays should be posted here in our Essay Writing forum, not in our Grammar forum.
- Essays should be posted here in our Essay Writing forum, not in our Grammar forum.
Get the Weekly English Kit 📬
New words, one handy idiom, and a 2-minute quiz — delivered to your inbox to keep your streak alive.
Essays should be posted here in our Essay Writing forum, not in our Grammar forum.
The line graph illustrates the amounts, in grams per person per week, of four different types of meat food which people in a European nation consumed from 1979 to 2004.
Overall, fish was the least commonly used food in the European country throughout the period shown. Also, the e
 Related Questions