
IELTS Writing task 1
Hi everyone, please help me check and rate my writing for task 1, also give me some advice. Which score you think my writing might get?
Thank you guys every much. I really appreciate.
It has 161 words.
The bar chart shows the scores of teams A, B and C over four different seasons.
Summarize the information by selecting and reporting the main features and make comparisons where relevant. Write at least 150 words.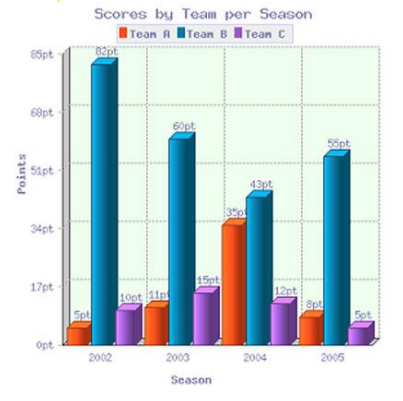
The chart illustrate the points scored by 3 different teams and how these points changed during the period from 2002 to 2005.
Overall, team B had the highest scores over the period shown. However, the scores of all 3 teams fluctuated every season.
In 2002, team B scored the highest, at 82 points in that season compare to only 5 points of team A. However, the score of team B dropped dramatically to 43 points over the following 3 years, whereas team A's score increased 30 points to 35 points in 2004. In the last season shown, there was a significant decline in the points scored by team A, from 35 points to 8 points. In contrast, the figure of team B slightly went up to 55 points.
Team C generally scored the lowest among 3 teams. With 10 points in 2002, this figure slightly decreased to 5 points in 2005, despite reaching its peak at 2003 where team C scored 15 points.
Top answer
Comment: The verb " fluctuate " has a specific scientific meaning. Fluctuations can be random or non-random. It is not really applicable to your chart of team scores.
- Comment: The verb " fluctuate " has a specific scientific meaning.
- Fluctuations can be random or non-random.
- It is not really applicable to your chart of team scores.
- The chart below clearly shows the annual fluctuations of measurements of atmospheric CO2 concentrations superimposed on an increasing trend at four recording stations.
Get the Weekly English Kit 📬
New words, one handy idiom, and a 2-minute quiz — delivered to your inbox to keep your streak alive.
Comment: The verb "fluctuate" has a specific scientific meaning. Fluctuations can be random or non-random. It is not really applicable to your chart of team scores.
The chart below clearly shows the annual fluctuations of measurements of atmospheric CO2 concentrations superimposed on an increasing tre
Here are some questions to think about.
Do you think these teams were playing different sports? (For example, team A was a football team, team B was a tennis team, and team C was a gymnastics team. )
Do you think that each team played only one game each season? Or that the scores are the total of more than one game?
Do you think that these teams were playing the same sport
 Related Questions